
Figures & data
Figure 1. The conceptual model.
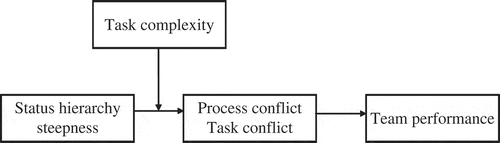
Table 1. Median within-group agreement (rwg(j)) and intraclass correlation coefficients for the study variables.
Table 2. Structural model comparisons (Models 1–3).
Table 3. Descriptive statistics and Pearson zero-order correlations among the study variables.
Figure 2. Interactive relationship of status hierarchy steepness and task complexity with process conflict.
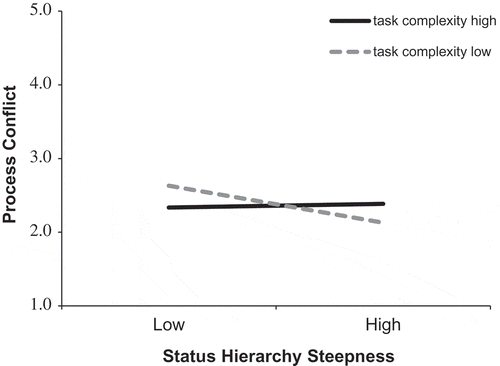
Figure 3. Interactive relationship of status hierarchy steepness and task complexity with task conflict.
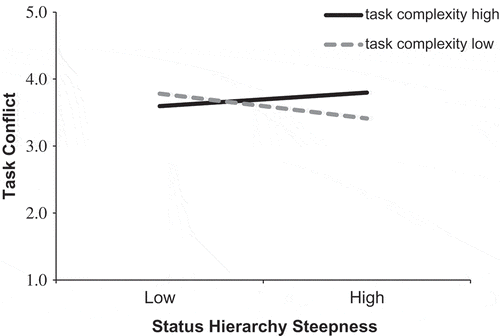
Figure 4. Interactive relationship of status hierarchy steepness and task complexity with team performance.
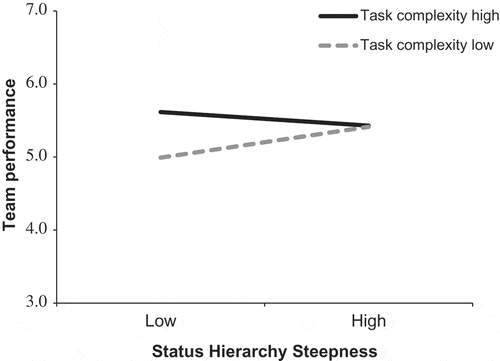
Table 4. Regression analyses results and conditional indirect relationships.
Appendix. Regression analyses results and conditional indirect relationships