Figures & data
Figure 1. Flow chart for the study.
Figure 2. The logic model of the study.
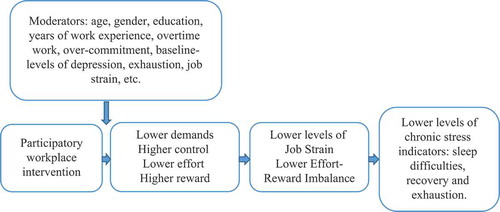
Table 1. Steps in the intervention.
Table 2. Descriptive data, intervention and control group, at baseline measurement (M1), 6-month (M2) and 12-month (M3) follow-up.
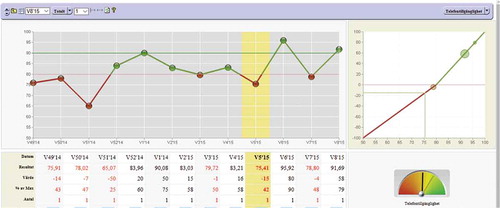
Table 3. Group-level monthly ratio between the total number of tasks (Tasks) and the total number of hours worked (Time); Time and total number of visits (including home visits, group visits, etc.); Time and total number of administrative tasks (Admin); Time and total number of telephone calls taken (Phone); and total number of patients on unit list (List) and Time. The results are given for the intervention group (I) and the control group (C).
Table 4. The difference in the quantitative workload between the intervention group (I) and the control group (C). T-test for dependent observations.
Table 5. Descriptive data for the outcome variables and the variables used in the analysis as covariates, at baseline measurement (M1) and at the 6-month (M2) and 12-month (M3) follow-ups.
Table 6. Interaction analysis for the intervention group, effort as outcome.
Table 7. Interaction analysis, reward as outcome. Difference in reward between the control and the intervention groups for different values of baseline (M1) exhaustion as measured by Oldenburg Burnout Inventory (Olbia).