Figures & data
Table 1. Means, standard deviations, correlations, and coefficient alpha’s of all the variables in study 1.
Figure 1. Visualization of constraints to capture the latent change score of the variable seeking resources. The numbers “1” represent the imposed constraints to specific parameters, whereas “c” indicates the parameters that are constrained for measurement error. The “Delta seeking resources” represents the latent change score of the variable seeking resources.
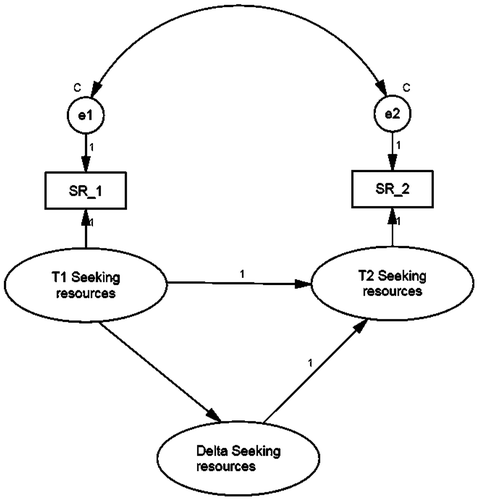
Figure 2. The hypothesized latent change score model. For all latent factors it applies that e.g. “ΔSC” represents the latent change score of the variable Seeking Challenges.
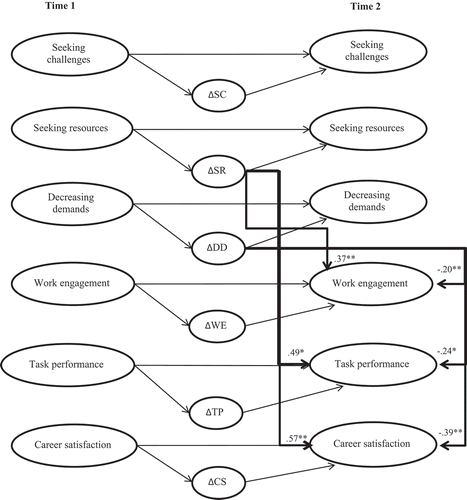
Table 2. Examples of self-set job crafting goals of the participants, study 2.
Table 3. Overview of the intervention of study 2.
Table 4. Means, standard deviations, Cronbach’s alphas, and correlations among the variables of study 2.
Table 5. Means and standard deviations of the Intervention and control group, study 2.
Table 6. Multi-level regression effects of the intervention on the outcome variables, study 2.
Figure 3. Simple slopes for the intervention and control group representing the slope of seeking resources over time.
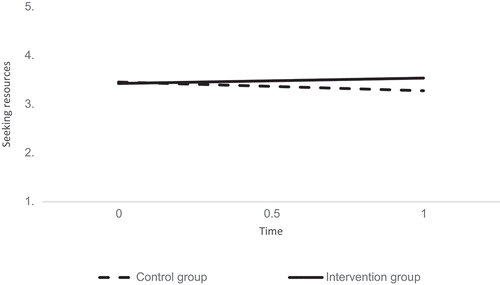
Figure 4. Simple slopes for the intervention and control group representing the slope of decreasing demands over time.
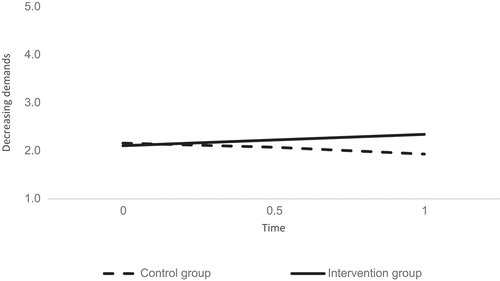
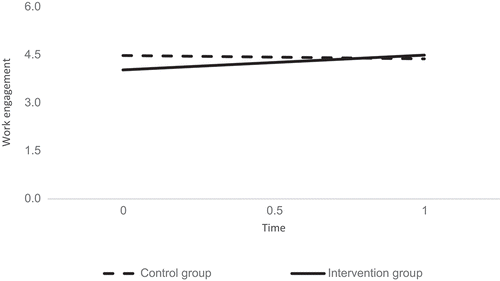
Figure 5. Simple slopes for the intervention and control group representing the slope of work engagement over time.
