Figures & data
Table 1. Ideological Self-Placement in Flanders and Wallonia.
Table 2. Three-Dimensional Ideology in Flanders and Wallonia (N in Parentheses).
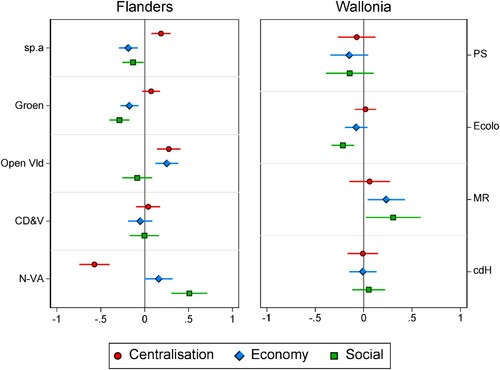
Figure 1. Graphical Representation of Voters’ Ideological Positioning. Note: Confidence intervals are at the 84% level following Macgregor-Fors and Payton (Citation2013). Confidence intervals of 84% are used in the figure, since a classic 95% confidence interval is computed against a baseline of zero and should not be compared to another mean. For instance, overlapping 95% confidence intervals may not necessarily mean that a different is not significant. Macgregor-Fors and Payton (Citation2013) demonstrate that when comparing two values against each other, an 84% confidence interval is the equivalent of a 95% confidence interval.
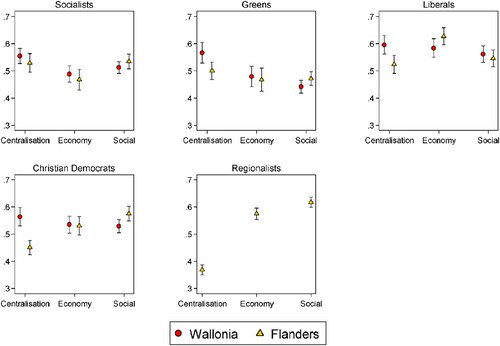
Figure 2. Ideological Positioning of Voters (Marginal Effects). Note: Confidence intervals are at the 95% level.