Figures & data
Table 1. Alternative admission pathways into university.
Table 2. Bachelor student sample characteristics, commencing in 2015.
Table 3. Intersectionality among equity student groups (%).
Table 4. Admission pathways – commencing domestic Bachelor students in 2015.
Table 5. Admission pathway proportions (%) for commencing domestic Bachelor degree students, 2011–2019.
Figure 1. Proportion of equity students entering via secondary education, 2011–2019.
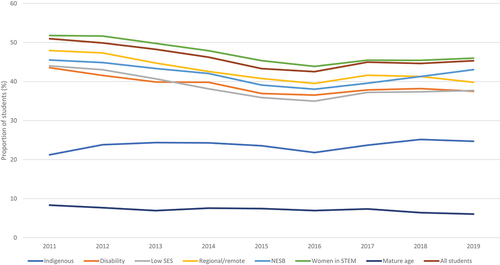
Figure 2. Proportion of equity students entering via higher education course, 2011–2019.
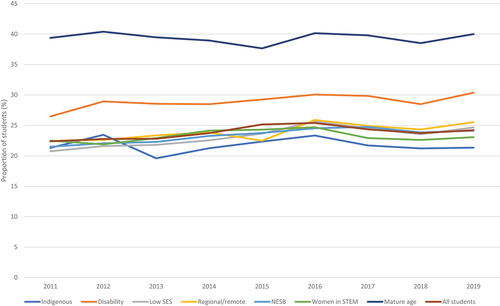
Figure 3. Proportion of equity students entering via vocational education, 2011–2019.
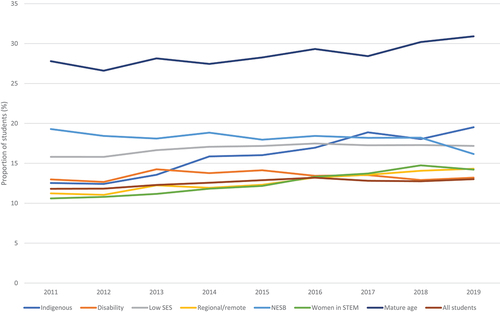
Figure 4. Proportion of equity students entering via mature-age entry provisions, 2011–2019.
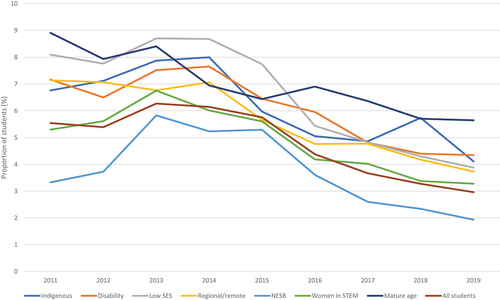
Figure 5. Proportion of equity students entering via professional qualification, 2011–2019.
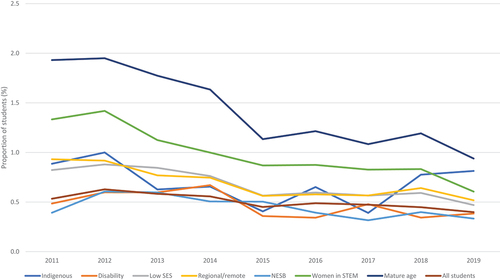
Figure 6. Proportion of equity students entering via ‘other basis’, 2011–2019.
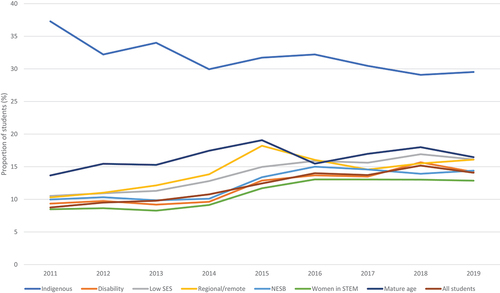
Figure 7. Ratio of secondary-to-alternative pathway by equity group, 2011–2019.
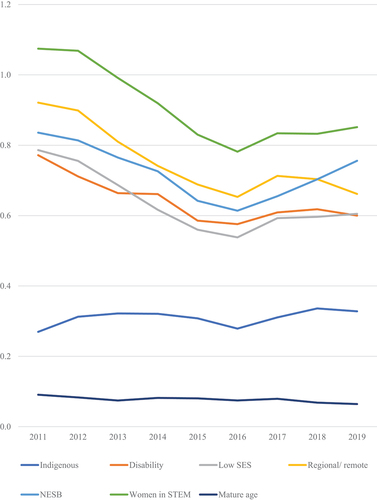
Table 6. Multinomial logistic regression estimates of entry pathway choice relative to ‘secondary education’ (relative log odds).
Figure 8. Ratio of secondary-to-alternative pathway by discipline, 2011–2019.
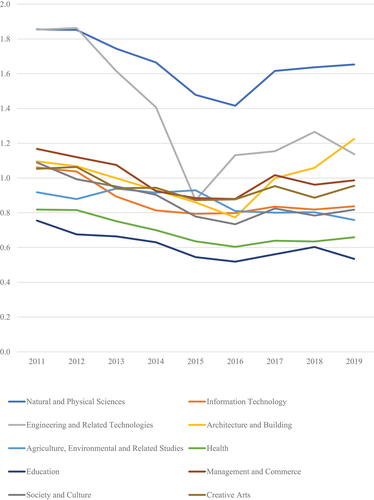
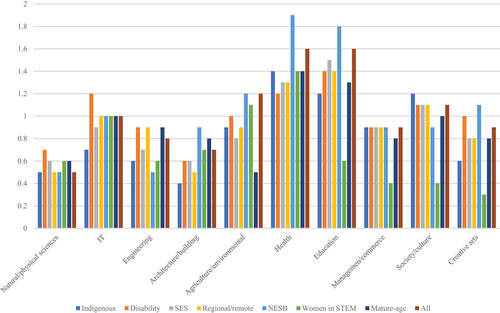
Figure 9. Ratio of secondary-to-alternative pathway by equity group and discipline in 2019.