
Figures & data
Figure 1. Regional trend in educational attainment.
Source: Authors’ calculations based on the EIC dataset.
Table 1. Average years of schooling by population subgroup, selected countries.
Table 2. Correlations of different measures of horizontal inequality.
Figure 2. Trends in educational attainment and horizontal inequalities.
Notes: fitted values adjusted for time- and country-fixed effects.Source: Authors’ calculations based on the EIC dataset.
Table 3. Horizontal inequality measures by ethnic groups.
Figure 3. Horizontal inequalities by ethnic groups.
Source: Authors’ calculations based on the EIC dataset.
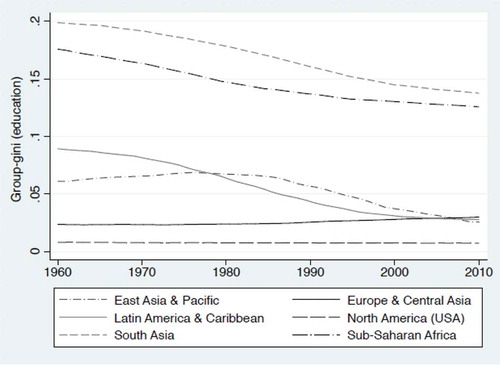
Figure 4. Horizontal inequalities by religious groups.
Source: Authors’ calculations based on the EIC dataset.
Table 4. Changes in horizontal inequalities, 1960–2005.