
Figures & data
Table 1. Gender disparities in Nepalese education
Figure 1. The location of our survey sites.
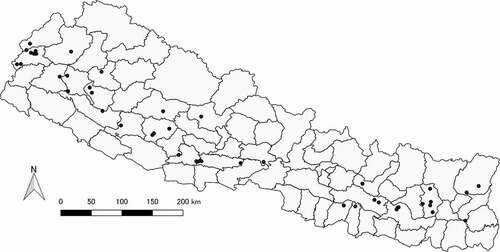
Table 2. Household access to water in the study region
Figure 2. Net attendance ratio of children aged 4–18.
Source: Calculated by authors from our original survey.
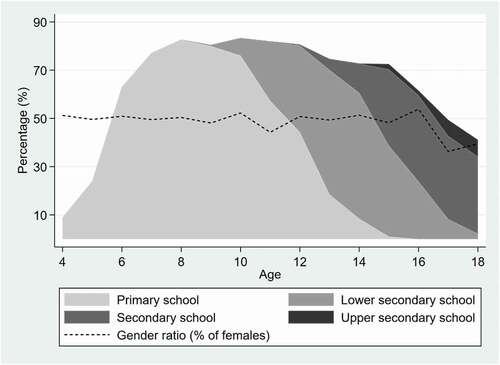
Table 3. Summary statistics of main variables
Table 4. Balancing and correlation tests for the identification assumption
Table 5. Impact on education: current (last attended) grade and repetitions [Children aged 6–16]
Table 6. Impact on education: completion of primary and lower-secondary schools [Children aged 14–16]
Table 7. Impact on household chores [Children aged 6–16]