Figures & data
Table 1. Fit indices of the confirmatory factor analyses.
Table 2. Range, mean and SD of parent and child characteristics.
Table 3. Quantiles, range, and means and standard deviation of outcome variables, n = 72.
Figure 1. (a–c) Boxplots of median and standard deviations of type of disability on the inclusion outcomes. (d–f) Boxplots of median and standard deviations of degree of disability on the inclusion outcomes.
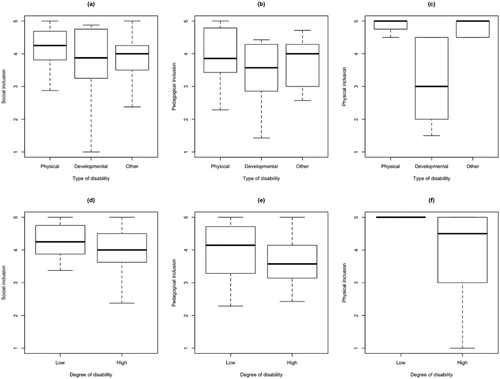
Table 4. Pearson correlation between the continuous variables.
Figure 2. (a-c) Effects of (a) attitudes towards inclusion, (b) PE-related information, and (c) type of disability (Others) on social inclusion. Quantile and OLS regression coefficients. QR: Points and whole line: filled points = significant effects, open points = not significant. OLS: whole line: black when significant, otherwise grey.
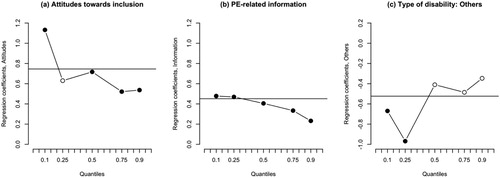
Table 5. Final model of social inclusion. OLS and QR.
Table 6. Final model of pedagogical inclusion. OLS and QR.
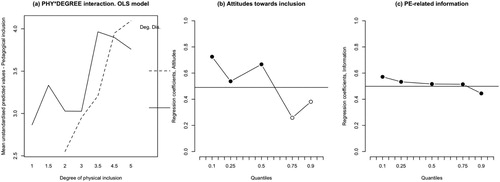
Figure 3 (a). Effect of the interaction between physical inclusion and degree of disability in the OLS model. Dotted line = low degree of disability, whole line = high degree of disability. (b-c) Effects of (b) attitudes towards inclusion, and (c) PE-related information on pedagogical inclusion. Quantile and OLS regression coefficients. QR: Points and whole line: filled points = significant effects, open points = not significant. OLS: whole line: black when significant, otherwise grey.