
Figures & data
Table 1. Comparison of the empirical findings from Piezunka, Schaffus, and Grosche (Citation2017) and the theoretical review from Göransson and Nilholm (Citation2014).
Table 2. Participants by professional background.
Table 3. Students from teaching degree programs by type of teaching degree.
Table 4. The complete set of items generated for the FEDI linked to their underlying dimensions.
Table 5. Properties of the FEDI items linked to their FEDI scales.
Figure 1. Scree plot of observed data.
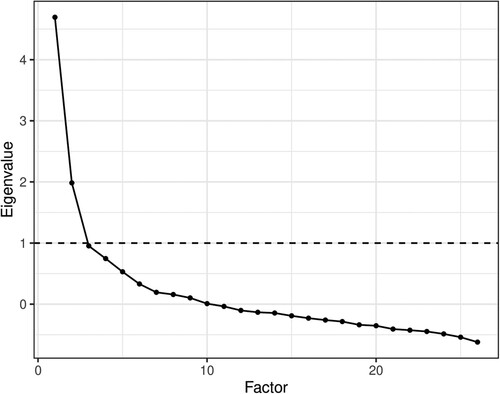
Figure 2. The model specified for the CCFA with empirical standardised coefficients and covariances.
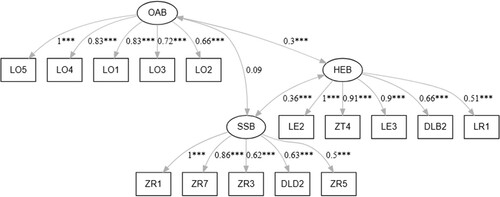
Figure 3. DIF-analysis of the FEDI-items.
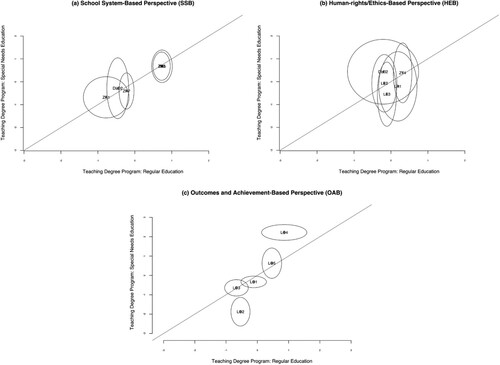
Table 6. MIV across university students attending a teaching degree programme for special needs education and for general education.
Figure 4. Histograms of relative frequencies of the FEDI scores.
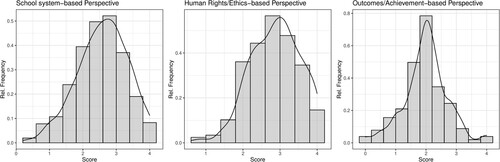
Table 7. Scale properties of the three FEDI scales.
Table 8. Correlations between the FEDI scales, attitudes towards inclusion, and teachers’ sense of efficacy.