Figures & data
Table 1. Demographic characteristics of participants.
Table 2. Scores of school staff on the KCAHW questionnaire by domain and total knowledge.
Figure 1. Knowledge scores shown by experience of ASC and occupation.
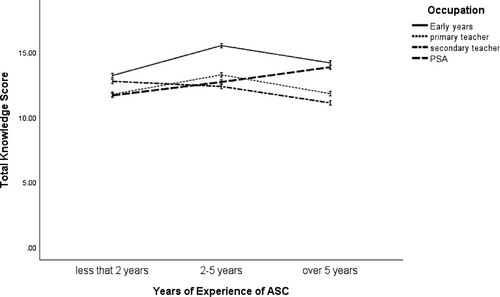
Table 3. Themes representing perceived barriers of inclusion.
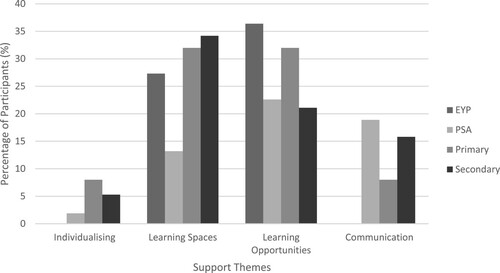
Table 4. Themes representing participants’ support suggestions.
Figure A1. Perceived barriers: themes by participant group.
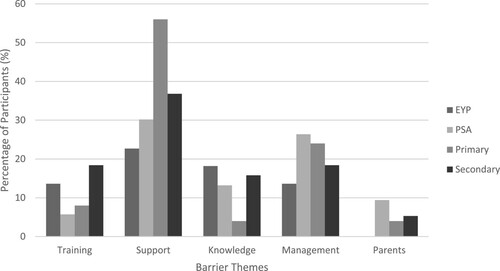
Figure A2. Suggestions for support by participant group.