
Figures & data
Figure 1. Search procedure PRISMA-2020.
Table 1. Main information of data using descriptive statistics.
Figure 2. Number of papers by years.
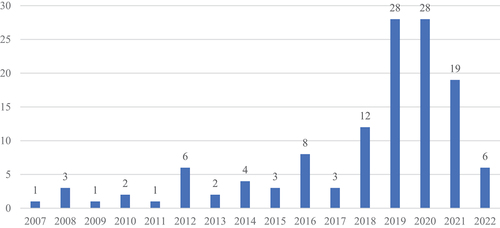
Table 2. Number of papers by regions.
Table 3. Top 10 countries in research domain.
Table 4. Scopus journals that published most papers in related studies in 2007–2022.
Table 5. Research methods used in the studies.
Figure 3. Network map of keywords co-occurrence in research.
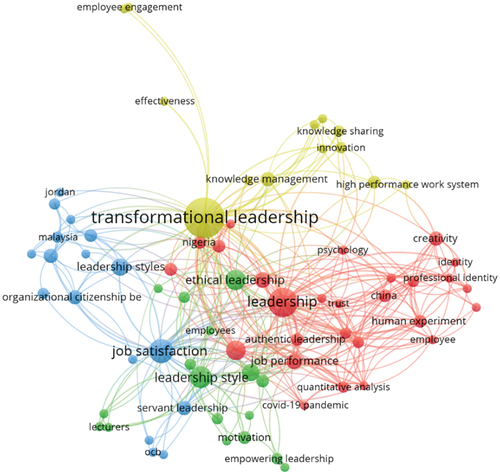
Figure 4. Network map of most cited authors in research.
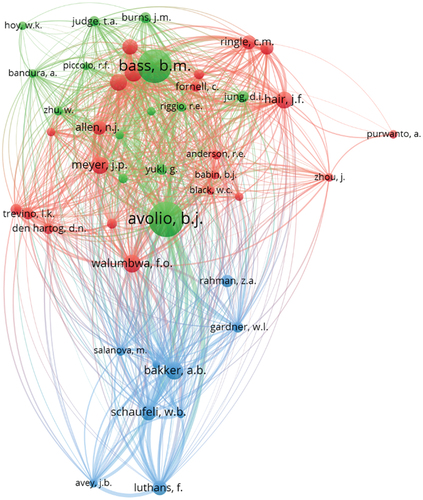
Figure 5. Network map of most referenced papers in research.
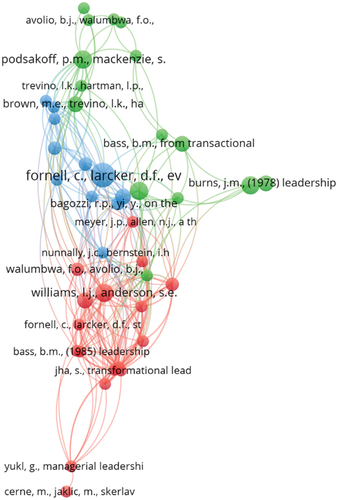
Figure 6. Summary of variables in related papers.
Figure 7. The relationship between most studied leadership styles and outcomes.
Figure 8. The relationship between other leadership styles and outcomes.
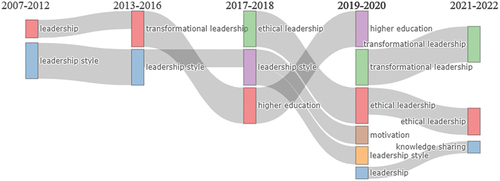
Figure 9. Thematic evolution of keywords in the research domain.
Data availability statement
The authors confirm that the data (articles) supporting the findings of this study are available within the article as supplementary materials and can be found in Appendix.