Figures & data
Table 1. Description of baseline sample ELSA wave 1.
Figure 1. CASP-19, social class and dropping out.
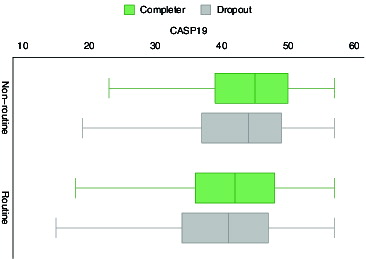
Table 2. Trajectories of CASP-19 in England 2002–2010.
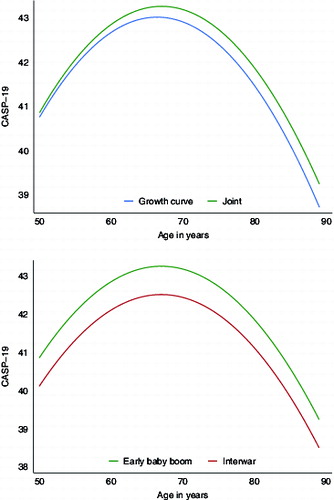
Table 3. Top panel: the peaks of the third age when attrition is assumed random in growth model versus when attrition in jointly modelled; bottom panel: the level-difference across cohorts in CASP-19, reference is the baby boomers cohort, based on the joint model.
Figure 2. Comparing trajectories of cohorts. Top panel: joint model (higher overall) accounts for attrition while growth curve model assumes attrition at random; bottom panel: both models account for attrition and show early baby boomers have higher CASP-19 scores than those born between the wars.