Figures & data
Table 1. Education Characteristics of Older Mexicans Stratified by Age, Gender, and Cross-Section.
Table 2. Z-Scores of Total and Task-Specific Cognitive Assessments of Older Mexicans Stratified by Age, Gender, and Cross-Section.
Table 3. OLS Regression of Z-Scores in Total Cognitive Scores and in the Five Domains of Cognition, 2001 and 2012.
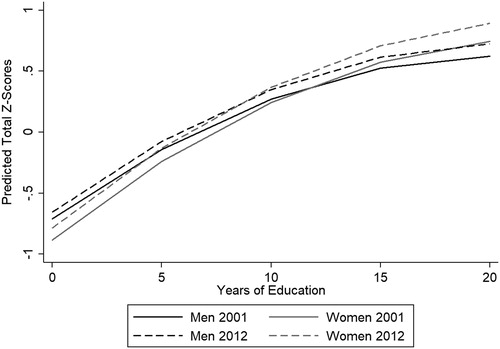
Figure 1. Predicted Total Cognition Z-Scores for Older Mexicans by Years of Education, Gender, and Cross-Section. Note: Solid lines correspond to 2001 and dashed lines to 2012. Black corresponds to men and gray to women. Source: Authors’ own elaboration with data for older adults aged 60 years or older from the Mexican Health and Aging Study, Wave 1 (2001) and Wave 3 (Citation2012).