
Figures & data
Table 1. Sample description (n = 3019).
Table 2. Characteristics of work-family trajectories, n = 3019.
Figure 1. Chronograms by cluster of work-family trajectories for men (n = 1482) and women (n = 1537).
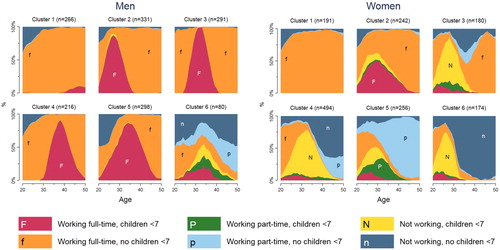
Table 3. Multivariate regression estimates for depressive symptoms for men: unstandardized regression coefficients (b), confidence intervals (CI 95%) and p-values.
Table 4. Multivariate logistic regression estimates for antidepressant use for men: Odds Ratios (OR), confidence intervals (CI 95%) and p-values.
Table 5. Multivariate regression estimates for depressive symptoms for women: unstandardized regression coefficients (b), confidence intervals (CI 95%) and p-values.
Table 6. Multivariate logistic regression estimates for antidepressant use for women: Odds Ratios (OR), confidence intervals (CI 95%) and p-values