
Figures & data
Table 1. Distribution of the total sample of older adults and caregivers inside the household, showing the person-year observations and individuals, by country of residence.
Table 2. Sample sociodemographic and health characteristics by caregiving status.
Figure 1. Mean life satisfaction by caregiving status and wealth quintile showing 95% confidence intervals. Source: SHARE waves 2,4,5,6. Authors’ calculations.
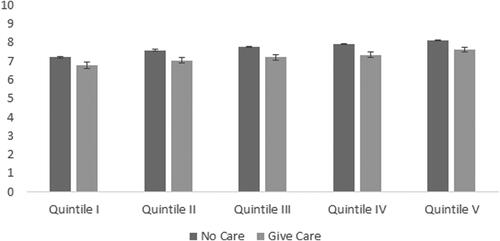
Table 3. Pooled ordinary least square regression and fixed effects regression coefficients showing main and interaction effects of care provision and wealth on life satisfaction.
Table 4. Pooled ordinary least square regression and fixed effects regression coefficients showing the relationship between care provision and life satisfaction by wealth quintile.