
Figures & data
Figure 1. Flowchart of inclusion process.
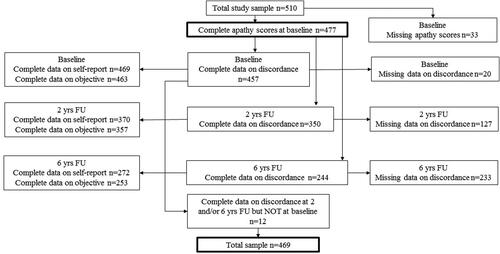
Table 1. Baseline characteristics.
Figure 2. Individual trajectories of discordance based on individual discordance-scores across three waves (baseline, two, and six years). The red line demonstrates the estimated mean and grey lines represent individual trajectories (n = 469).
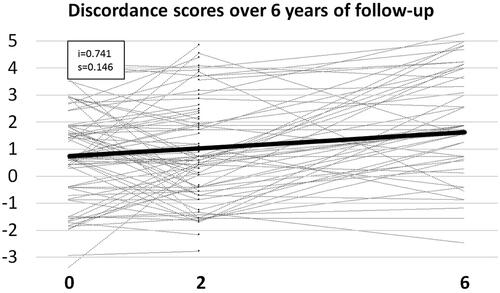
Table 2. Bivariable latent growth models for the association with discordance-score at baseline (intercept) and change of discordance-scores over time (slope).
Table 3. Multivariable Latent Growth Models for the association with discordance-score at baseline (intercept) and yearly change of discordance-scores (slope).
Supplemental material