
Figures & data
Table 1. Baseline characteristics (N = 15,582).
Figure 1. Score distribution for cognitive function*.
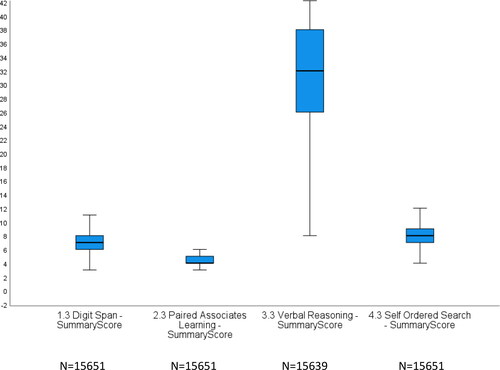
Table 2. Univariate analysis for drinking risk at baseline.
Table 3. Drinking status at baseline as predictor of cognitive function and functional decline at year 2.
Table 4. Baseline drinking status and cognitive function at Year 2.
Table 5. Baseline risky drinking status as a predictor of cognitive function at Year 2.