
Figures & data
Table 1. Sample characteristics at Wave 1.
Figure 1. Four-class model of physical multimorbidity patterns at Wave 1..
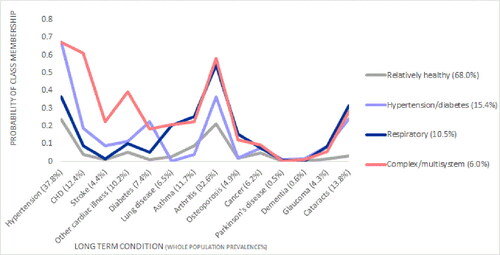
Table 2. Means and standard deviations for cultural engagement, civic participation, and leisure activities for the maximal sample available at each wave.
Table 3. Associations between multimorbidity patterns at Wave 1 and cultural engagement, civic participation, and leisure activities over all waves.
Supplemental material