
Figures & data
Table 1. Socio-demographic characteristics of participants and descriptive statistics.
Figure 1. Means of indicator variables corresponding to each of the three profiles (z-scores).
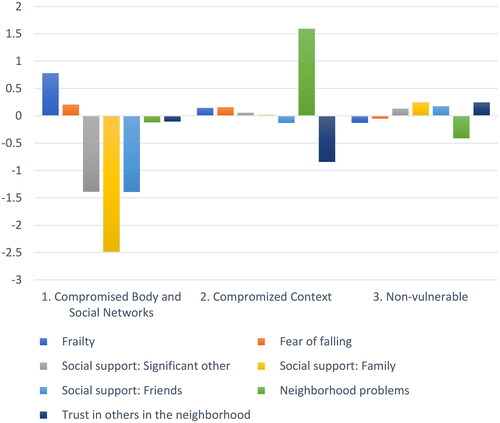
Table 2. Summary of model fit statistics for models with one to four classes.
Table 3. Multinomial logistic regression predicting profile membership.
Table 4. Results of the Kruskall-Wallis H tests (post-hoc pairwise comparisons of differences between the profiles).
Data availability statement
The data presented in this article are not readily available because of participant confidentiality. Requests to access the data should be directed to [email protected].