
Figures & data
Figure 1. Process of inclusion of participants to the study.
Flow chart showing participant inclusion into the study, whereby 44 people were eligible and 34 were included.
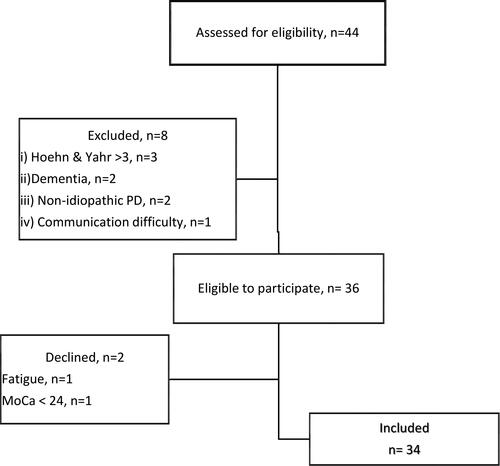
Figure 2. The relationship between participants’ perceived ability to use ET and perceived ET challenge. Each # represents one participant. M = Participants’ mean perceived ability measure (56.21) and the mean perceived challenge level measure of the ETs (50.00).
Right side: Everyday technologies perceived as more challenging higher up, such as airport check-in, or least challenging, lower down, such as phone calls on smartphones. Left side: Participants rated their ability to use technology as high.
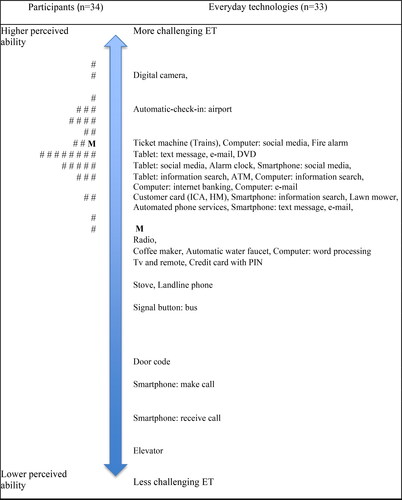
Table 1. Demographic and clinical characteristics of the study sample, n = 34.
Table 2. The ten everyday technologies perceived as most and least relevant.
Supplemental material