Figures & data
Figure 1. Short-term relationships between perceived negative ageism (PNA)/perceived positive ageism (PPA), and quality of life (QoL)/mental well-being (MWB). This figure illustrates the outcomes of two separate analyses. The left column shows the results of the two mediation models (a: PNA, b: PPA). The right column depicts the outcomes of the four linear regression models, separately for QoL and MWB, and PNA (a) and PPA (b). For this analysis, moderator window (i.e. time between T1 and T2) is not included in this illustration, as it was not included in any of the selected models. In both columns, only significant (p < .05) pathways are shown. Red lines denote negative associations, and blue lines denote positive associations. SPoA: self-perceptions of aging.
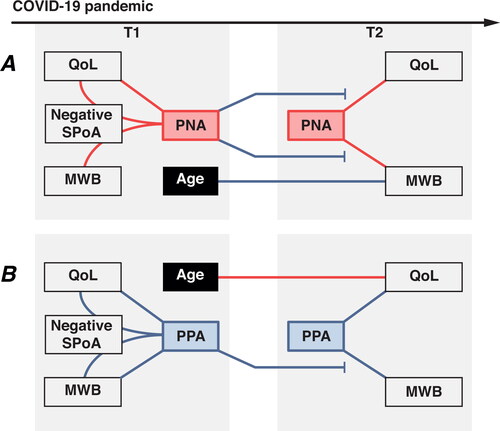
Table 1. Bivariate correlation coefficients of variables of interest.
Table 2. Direct and indirect effects, via self-perceptions of aging, of perceived negative ageism (PNA) and perceived positive ageism (PPA) on quality of life and mental well-being.
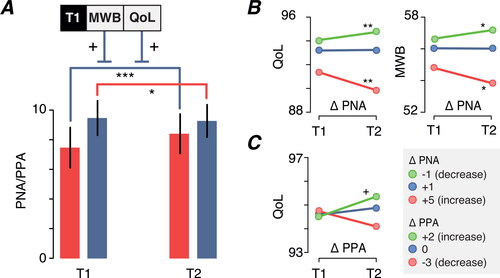
Figure 2. Changes in perceived negative ageism (PNA) and perceived positive ageism (PPA) during the COVID-19 pandemic, and the consequences for quality of life (QoL) and mental well-being (MWB). T1: first measurement wave; T2: second measurement wave. (a) Red bars represent PNA scores and blue bars represent PPA scores. Only significant moderators (MWB/QoL) are included. (b) The moderating effect of changes in PNA are shown, for QoL and MWB, separately. (c) The moderating effect of changes in PPA for QoL is shown. (b and c) Standard deviations are not shown to improve visibility. +p < .07, *p < .05, **p < .01, ***p < .001.