Figures & data
Figure 1. The relative differences of each domain per cluster (standardised cluster mean). the error bars represent the standard error (SE) of the means. Positive scores denote more self-reported WMQ problems. Negative scores denote less self-reported WMQ problems.
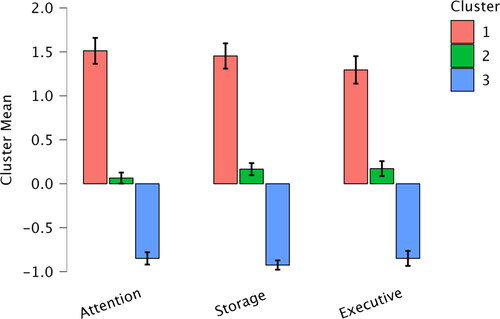
Table 1. Demographic and living arrangement profiles* (percent).
Table 2. Pastime profiles for the 3 clusters (values are percentages).
Figure 2. Mean scores on depression, anxiety, and stress in each Cluster. The error bars represent the standard error of the mean.
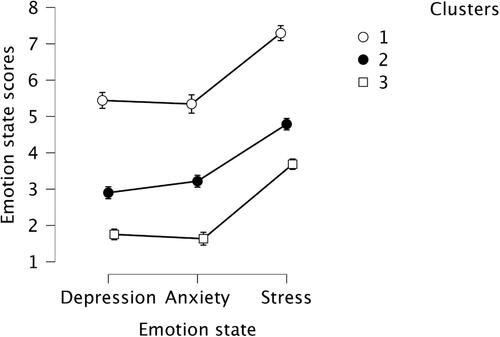
Figure 3. Mean scores of working memory problems in three domains (Attention, Storage and Executive). the error bars represent the standard error of the means.
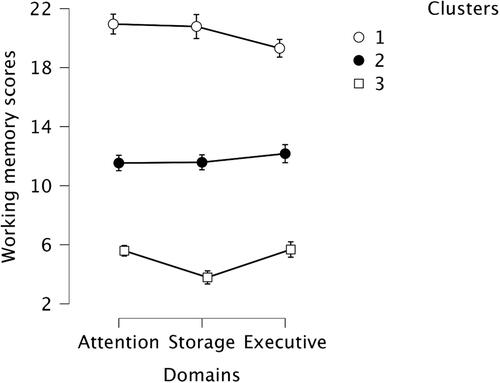
Figure 4. Mean UCLA scores. The error bars represent the standard error of the means.
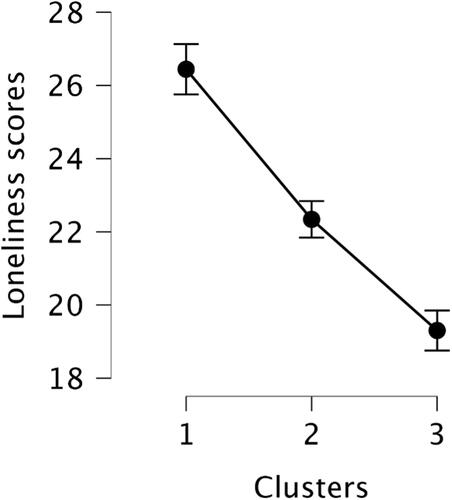
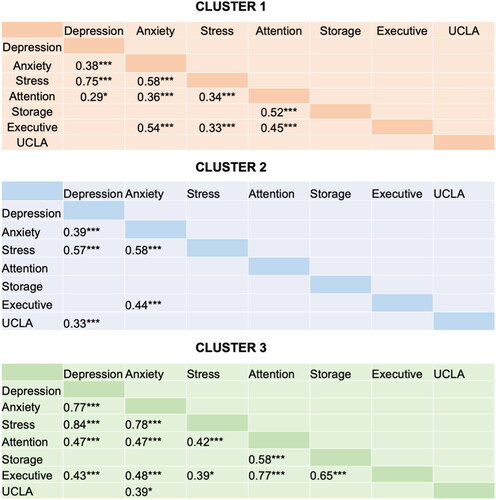
Figure 5. Spearman’s rho between working memory, emotion state and loneliness variables.
*BF10 > 10; **BF10 > 100; ***BF10 > 1000