Figures & data
Table 1. Means, standard deviations, characteristics of the sample.
Table 2. Exploratory factor analysis for environment at T1 (N = 1,314).
Table 3. Model fit statistics for latent class analysis on environment and social participation.
Table 4. Effects of personal factors, environment profiles, and social participation profiles on depressive symptoms and quality of life at T1 (N = 1,314).
Table 5. Effects of T1 personal factors, T1 environment profiles, and T2 social participation profiles on T2 depressive symptoms and quality of life (N = 830).
Figure 1. 3-class environment profiles at T1.
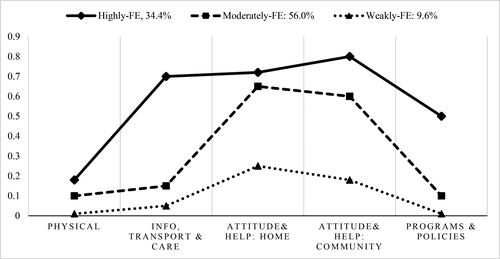
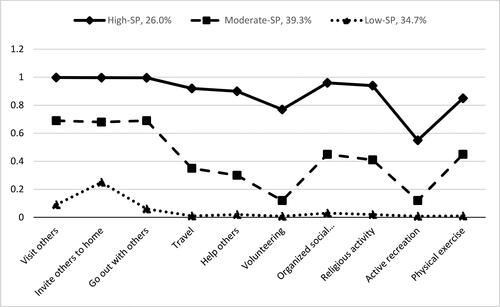
Figure 2. 3-class social participation profiles at T1.
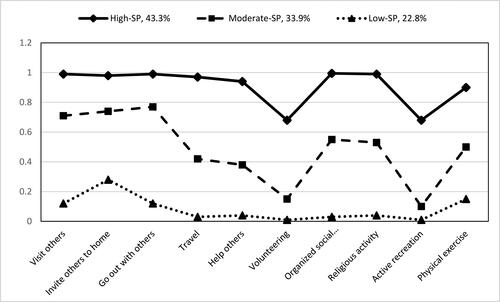
Figure 3. 3-class social participation profiles at T2.