
Figures & data
Figure 1. Recruitment and attrition flowchart.
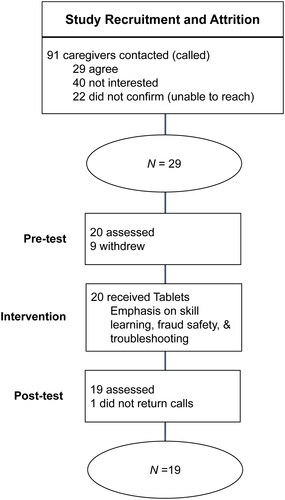
Table 1. Participant characteristics.
Table 2. Mean and SE of the BTACT, PERMA, TILS, PHQ-2, and growth mindset scores for pre-test and post-test.
Table 3. Results of linear mixed-effects models for all outcome measures.
Supplemental material
Supplemental Material
Download PDF (773.8 KB)Data availability statement
Data, analytic methods, and study materials will be made available upon request from the corresponding author.