Figures & data
Table 1. Italian cabinets and governmental majorities, 2008–2022.
Table 2. Priorities and preferences of Italian voters in 2022 for selected policy issues.
Figure 1. Turnout in Italian general elections since 1948.
Table 3. Results of 2022 Italian general election (Chamber of Deputies and Senate).
Figure 2. Votes for main Italian parties in 2018 and 2022 in absolute values and percentages on valid votes (in parentheses), Chamber of Deputies.
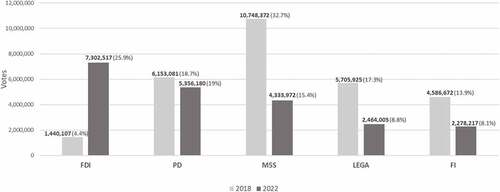
Figure 3. Most voted coalition/party in the Italian single-member districts (2022 and 2018 compared).
Table 4. Italian parties’ vote share by geopolitical area and demographic size of municipality, Chamber of deputies 2022.
Table 5. Vote for main Italian parties in the 2022 general election, by sociodemographic characteristics (percentages).
Table 6. Vote shifts between 2018 and 2022 in Italy: destination in 2022 of the 2018 voters of the different parties, loyal voters (confirming in 2022 their 2018 vote choice) in bold (percentages).
Table 7. Vote shifts between 2018 and 2022 in Italy: sources from 2018 electorates of the 2022 votes to different parties (percentages).
Figure 4. Evolution of electoral volatility in Italy, Chamber of Deputies (1948–2022).
Figure 5. Mean values of total volatility for most volatile sequences of three consecutive elections in Western European countries between 1946 and 2022.