
Figures & data
Figure 1. Comparative presence of the South European countries in articles published in South European Society and Politics, issues 1/1 to 28/1.
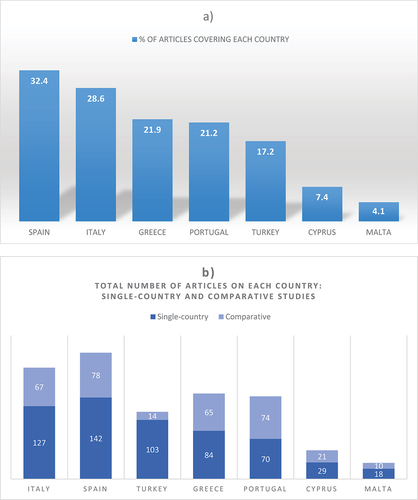
Table 1. Comparative special issues published by South European Society and Politics, 1996–2022.
Table 2. Single-country special issues published in South European Society and Politics, 1996–2022.
Figure 2. Main themes of articles published in South European Society and Politics, 1996–2022 (% of total).
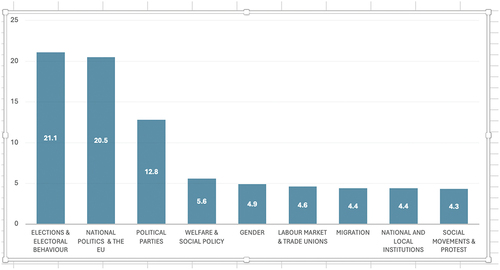
Table 3. Elections and referendums covered in articles in South European Society and Politics, 1996–2022.
Figure 3. Country of academic affiliation of SESP authors (%), 1996–2022.
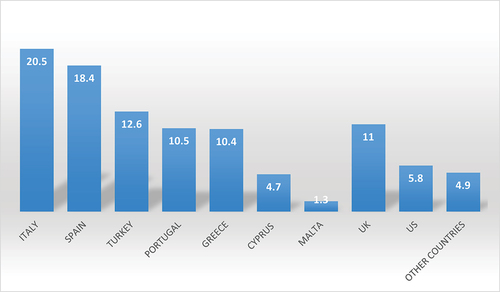
Figure 4. Percentage of female versus male authors in SESP, 1996–2022.
Figure 5. The shift from solo to co-authorship in SESP articles, 1996–2022 (%).
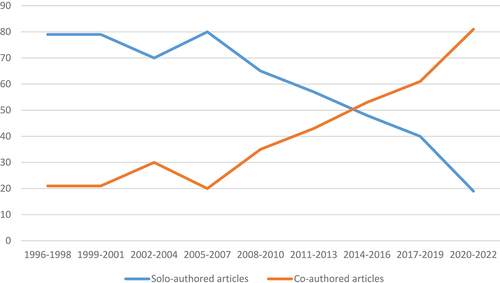
Figure 6. SESP’s academic footprint: article downloads and Impact Factor scores, 2009–2022.
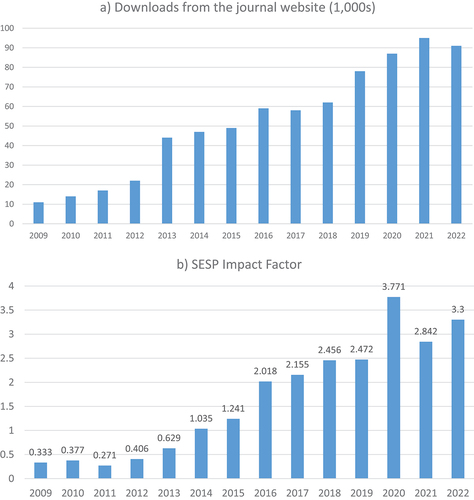
Table 4. The members of the SESP editorial team, 1996–2023.