Figures & data
Figure 1. Comparison of simulated typical in vivo release rates over the period of use (5 years for subdermal implant, LNG-IUS 20, and LNG-IUS 12, and 3 years for LNG-IUS 8). Solid line: predicted release rate. Limits of shaded area: 5th and 95th percentile of simulations. Simulations are shown for time ≥24 days (few data in the initial phase). IUS: intrauterine system; LNG: levonorgestrel.
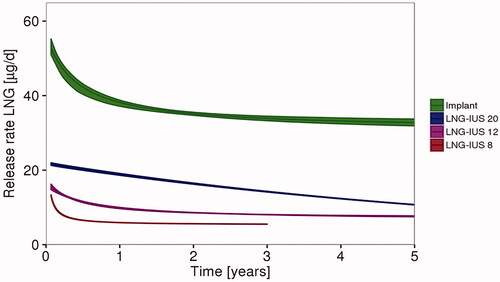
Table 1. Typical model-based estimated in vivo LNG release rates and descriptive statistics of model-based estimated total (and unbound) LNG serum concentrations at representative time points for LNG-IUSs and the subdermal implant, and total (and unbound) Cmax, Cav, and Cmin for POP and COC after Day 1 and Day 21 of oral administration (adapted from [Citation24]).
Table 2. Estimates of daily bioavailable dose and exposure of LNG among different contraceptive modalitiesTable Footnotea
Figure 2. Comparison of simulated typical LNG concentrations during the initial phase (A) and towards the end of the fifth year (B) of use (assuming body weight of 65 kg and SHBG baseline concentration of 60 nmol/L). COC: combined oral contraceptive; IUS: intrauterine system; LNG: levonorgestrel; POP: progestin-only pill. COC: 20 µg EE/100 µg LNG; POP: 30 µg LNG; implant release rate: Day 25, 53.0 µg/day; 5 years, 32.8 µg/day; LNG-IUS 20: Day 25, 21.7 µg/day; 5 years, 10.7 µg/day.
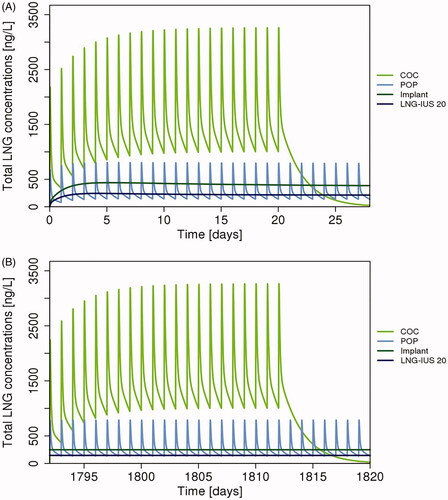
Figure 3. Boxplots of model-based estimated total LNG serum concentrations for: (A) COC and POP (Cmax, Cmin, Cav) at steady state and subdermal implant (1 month, 1 and 5 years); (B) POP (Cmax, Cmin, Cav) at steady state, implant and LNG-IUS 20 (1 month, 1 and 5 years); (C) LNG-IUS 20, LNG-IUS 12, LNG-IUS 8 (1 month, 1, 3, and 5 years). Note: Panel B purposefully includes POP and implant data repeated from Panel A and LNG-IUS 20 data repeated from Panel C in order to provide comparisons on an appropriate scale. COC: combined oral contraceptive; IUS: intrauterine system; LNG: levonorgestrel; POP: progestin-only pill.
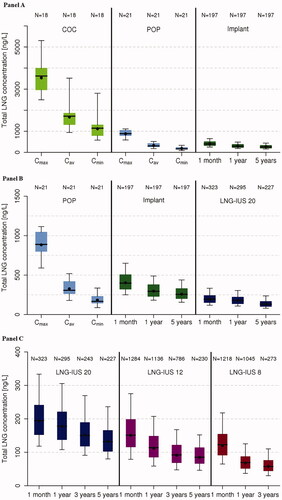
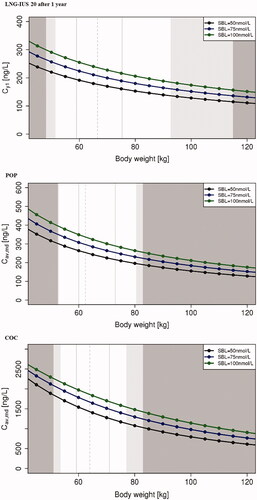
Figure 4. Simulated total LNG serum concentrations (ng/L) depending on body weight and SHBG baseline concentrations (SBL) for LNG-IUS 20 (1 year after placement), POP and COC (Cav, md). Dark grey shaded area: <min or > max of LNG-IUS 20/POP/COC population. Light grey shaded area: <5th percentile or >95th percentile of LNG-IUS 20/POP/COC population. Solid grey vertical lines: 25th or 75th percentile of LNG-IUS 20/POP/COC population. Dashed grey vertical line: median of LNG-IUS 20/POP/COC population. Cav,md: average serum concentration at steady state; Cy1: serum concentration after 1 year; COC: combined oral contraceptive; IUS: intrauterine system; LNG: levonorgestrel; POP: progestin-only pill; SBL: SHBG baseline concentration; SHBG: sex hormone-binding globulin.