
Figures & data
Figure 1. Bleeding intensity during days 0–360 post-placement of levonorgestrel-releasing intrauterine system, compiled from bleeding-diary entries from all participants using LNG-IUS 12 in two in clinical trials [Citation13,Citation28]. Each row represents data from one individual participant.
![Figure 1. Bleeding intensity during days 0–360 post-placement of levonorgestrel-releasing intrauterine system, compiled from bleeding-diary entries from all participants using LNG-IUS 12 in two in clinical trials [Citation13,Citation28]. Each row represents data from one individual participant.](/cms/asset/dbe6290d-4a71-444a-9c83-393bd5ac3cdd/iejc_a_1843015_f0001_c.jpg)
Figure 2. Bleeding intensity from daily bleeding diaries during days 0–270 post-placement of LNG-IUS 12 in clinical trials [Citation13,Citation28], clustered by bleeding pattern for the fixed-cluster model. Each row represents data from one individual participant.
![Figure 2. Bleeding intensity from daily bleeding diaries during days 0–270 post-placement of LNG-IUS 12 in clinical trials [Citation13,Citation28], clustered by bleeding pattern for the fixed-cluster model. Each row represents data from one individual participant.](/cms/asset/a3ae61b9-f99a-42c6-acf6-9a65194e21b2/iejc_a_1843015_f0002_c.jpg)
Figure 3. Bleeding patterns for participants using LNG-IUS 12 who were assigned to the ‘predominantly bleeding’ cluster, normalised with respect to cycle length and start of first bleeding/spotting episode within days 91–270. Each row represents data from one individual participant. LNG-IUS, levonorgestrel-releasing intrauterine system.
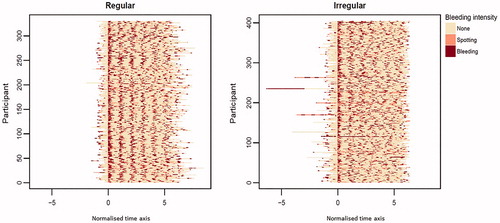
Table 1. Fixed-cluster model performance analysis with LNG-IUS data showing proportion of women allocated to each cluster and correct classification rates.
Figure 4. Sizes of the true and predicted clusters by device and cluster type. LNG-IUS, levonorgestrel-releasing intrauterine system.
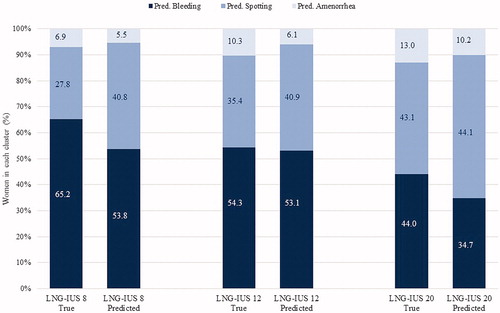
Figure 5. Proportion of women with regular and irregular cycles by device in the regularity assessment. LNG-IUS, levonorgestrel-releasing intrauterine system.
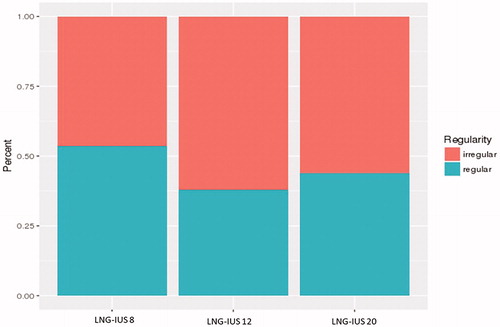
Figure 6. Logistic regression of regularity by device in the fixed-cluster model. The model’s ability to predict regularity is indicated by the amount of overlap between the coloured bars, with greater separation between the coloured bars indicating better prediction. LNG-IUS, levonorgestrel-releasing intrauterine system.
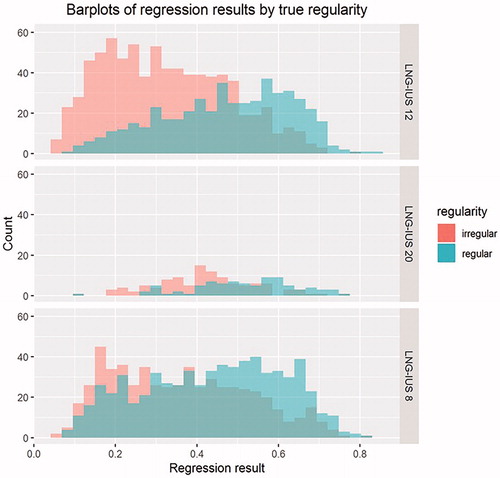
Figure 7. Receiver operating characteristics plot for LASSO regularity regression model in the fixed-cluster model demonstrating highest sensitivity and specificity is achieved for LNG-IUS 12. LASSO, least absolute shrinkage and selection operator; LNG-IUS, levonorgestrel-releasing intrauterine system.
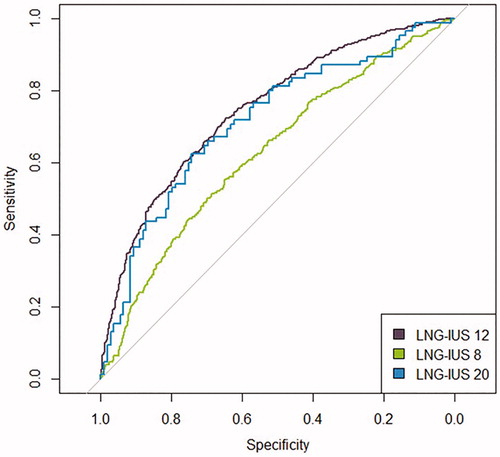
Figure 8. Histogram and median values of autocorrelation values by group during days 91–270 in the regression-tree model. The model’s ability to predict regularity is indicated by the amount of overlap between the coloured bars, with greater separation between the coloured bars indicating better prediction. Autocorr., autocorrection.
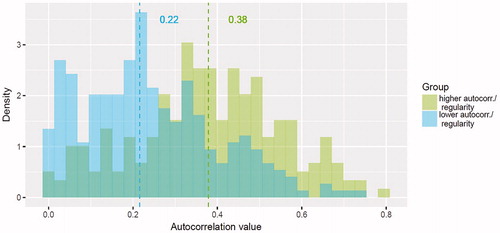
Figure 9. Distribution and median values of the number of bleeding days by subgroup during days 91–270 in the regression-tree model.
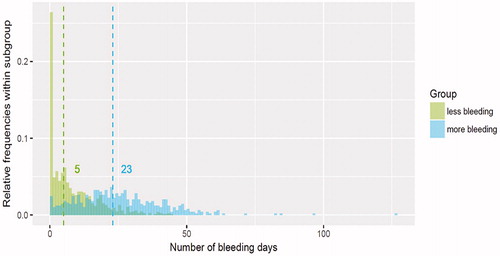
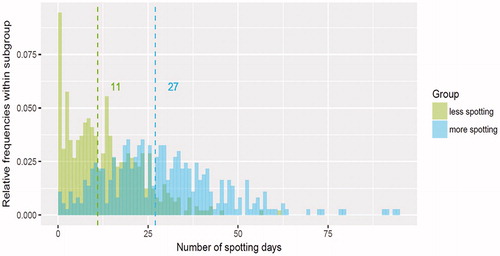
Figure 10. Distribution and median values of number of spotting days by subgroup during days 91–270 in the regression-tree model.
Supplemental Material
Download MS Word (13.8 KB)Data availability
The datasets generated and/or analysed during the current study are available in the Clinical Study Data Request (CSDR) repository, https://clinicalstudydatarequest.com