
Figures & data
Figure 1. Regression coefficient plot of party support plot with 95 per cent confidence intervals.
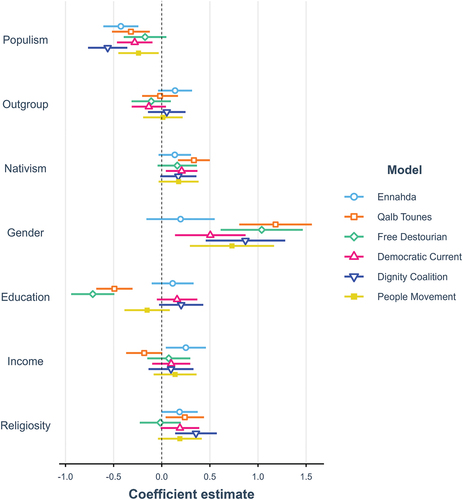
Figure 2. Regression coefficient plot of party leaders’ support with 95 per cent CI.
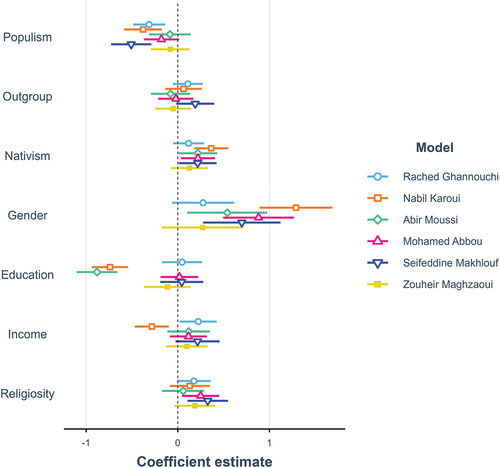
Figure 3. Odds Ratios (95 per cent CI). Voters are compared to non-voters, and voters of Kais Saied are compared to all other presidential candidates.
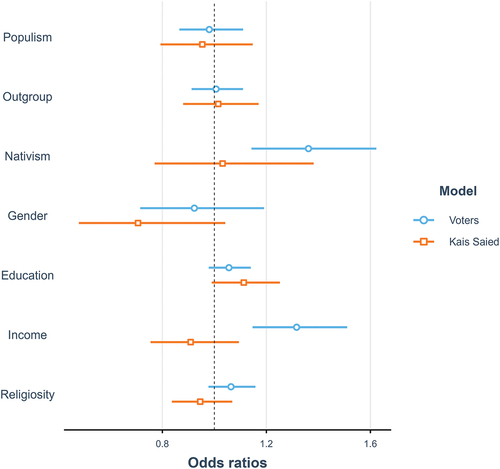
Table B1. Comparison between population estimates and unweighted survey distribution on key variables: age, education, and gender.
Table B2. Descriptive statistics of some key variables from the CSES dataset.
Figure B1. Choropleth of Sample vs. Population Distribution.
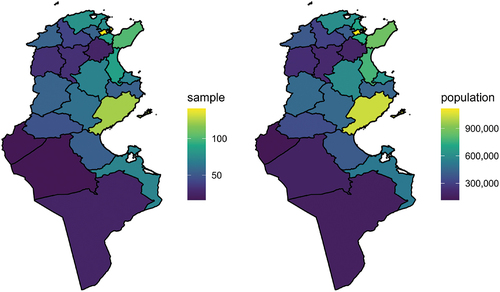
Figure B2. Populist attitudes items.
Figure B3. Attitudes towards the outgroup items.
Figure B4. Nativism items.
Figure B5. Comparing Tunisia to other CSES countries on the three subscales.
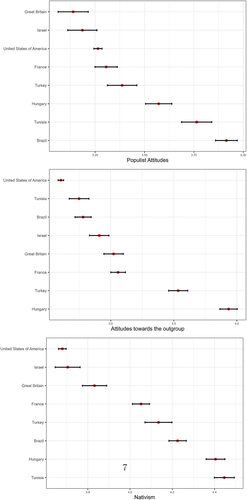
Table C1. Exploratory factor analysis using the 16 items from the CSES module 5 scales (N = 1477). Items with loading 0.3 bolded and retained for the next analysis. Model fit indices: RMSEA = 0.04, CFI = 0.97, TLI = 0.93, SRMR = 0.019. Factor rotation used: Geomin.
Table D1. Regression models for political parties: Entries are regression coefficients with standard errors in parentheses.
Table D2. Regression models for leaders of leaders: Entries are regression coefficients with standard errors in parentheses.
Table E1. Regression models for voters among political parties’ supporters: Entries are regression coefficients with standard errors in parentheses.
Table E2. Regression models for voters among party leaders’ supporters: Entries are regression coefficients with standard errors in parentheses.
Table E3. Logit regression models: standard errors in parentheses. The reference category for model (1) are non-voters in the presidential elections. The reference category in model (2) are all other presidential candidates.