
Figures & data
Figure 1. Reference mid-rise building designed to the Portuguese REBA (Citation1967) guidelines (in m).
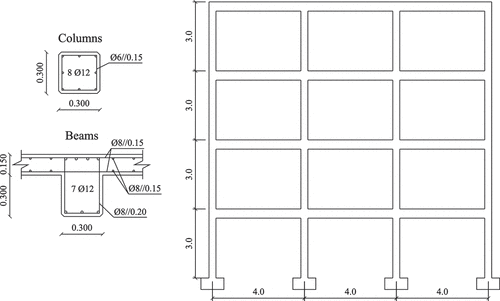
Table 1. Eurocode 8 target displacements in m (and roof drifts in %) for the three buildings for a reference pga of 0.25 g.
Table 2. Compliance criteria for the assessment of RC structures and retrofitted members in Eurocode 8.
Figure 2. (a) Retrofit of column and joint in both retrofit schemes; (b) additional retrofitting applied in the global retrofit scheme.
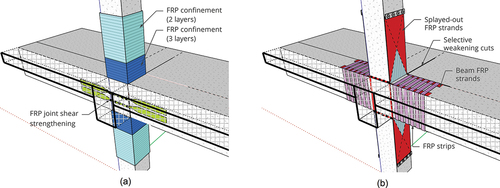
Figure 3. Detailing of the vertical FRP strands for flexural strengthening of the columns.
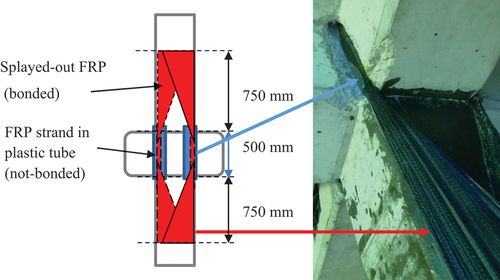
Figure 4. Details of beam FRP strengthening and selective weakening cuts.
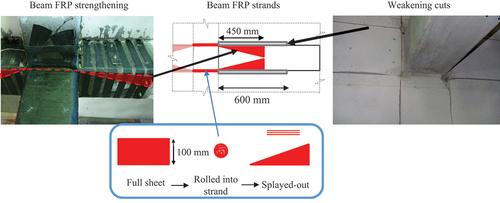
Figure 5. (a) Model of the retrofitted joint; (b) section detail for FRP retrofitted RC columns.
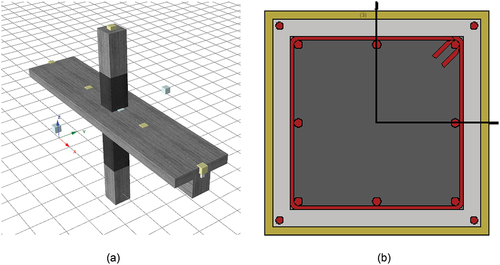
Figure 6. Hysteresis curves of the experimental and modelled beam-column joints for the control (C1) and global FRP retrofit (C1-RT-B-sw) specimens.
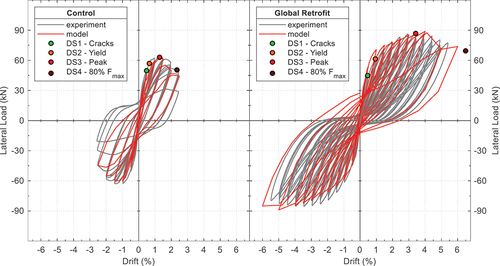
Figure 7. Target and mean spectra for the 20 selected ground motion records, normalised by pga.
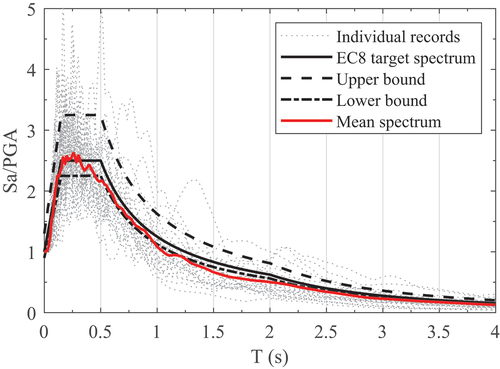
Table 3. List of selected 20 earthquake records for the incremental dynamic analysis.
Table 4. Inter-storey drift values for the four damage states.
Table 5. Damage-to-loss function for Portuguese RC buildings according to Silva et al. (Citation2015).
Table 6. Costs and areas assumed in the cost-benefit analysis.
Figure 8. Summary of the procedure for EALs calculation: (a) fragility curve; (b) damage to loss function; (c) vulnerability curve; (d) hazard curve; (e) expected annual loss.
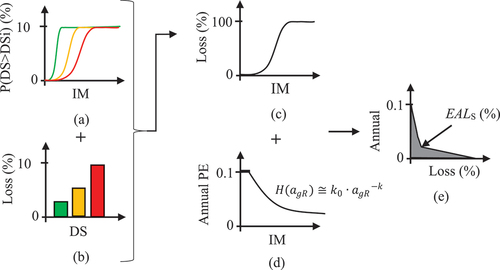
Figure 9. Push-over curves up to ultimate roof drift for the as-built and retrofitted RC buildings.
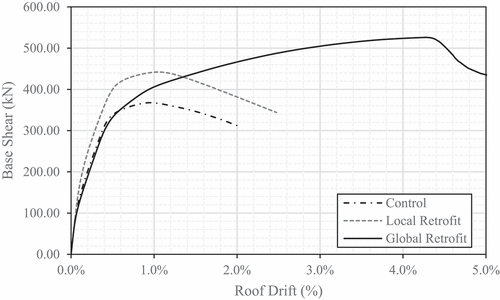
Figure 10. Deformed shapes of the (a) control, (b) local retrofit and (c) global retrofit at the NC target displacement.
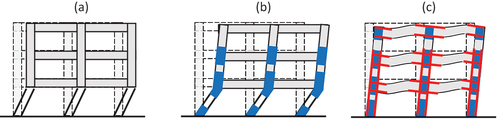
Figure 11. Fragility curves of the as-built, locally retrofitted and globally retrofitted building in terms of pga (a-c) and Sa(T1) (d–f).
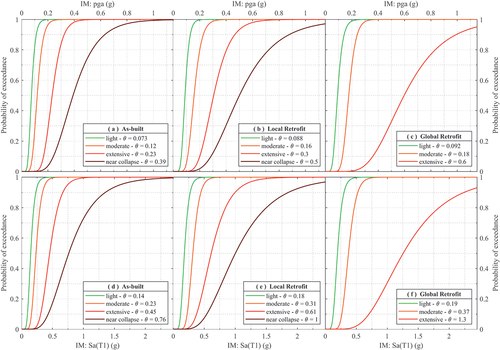
Table 7. Mean pga and standard deviation for the fragility curves of the as-built and retrofitted building.
Table 8. Mean Sa(T1) and standard deviation for the fragility curves of the as-built and retrofitted building.
Figure 12. Vulnerability curves of the as built control building, the local retrofit and the global retrofit.
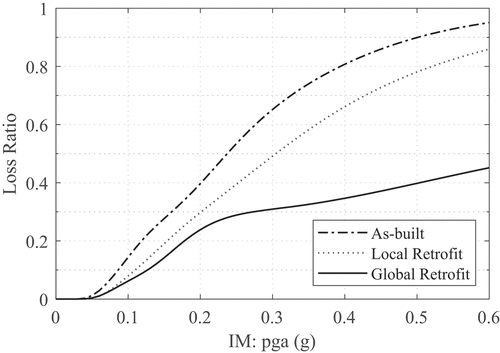
Figure 13. (a) Expected annual losses and (b) payback times for the three buildings for different levels of seismic hazard.
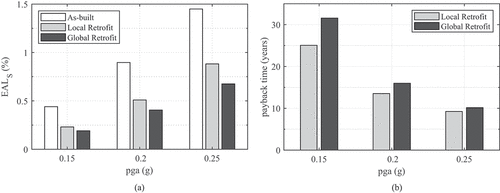
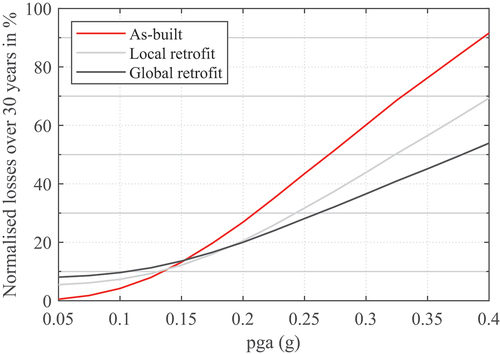
Figure 14. Normalised losses over 30 years for an extended range of seismic hazard for the as-built and retrofitted buildings.
Data Availability Statement
The data that support the findings of this study are available from the corresponding author, upon reasonable request.