Figures & data
Figure 1. Adapted PRISMA (Moher et al. Citation2009) flow diagram.
Figure 2. Inclusion criteria flow diagramFootnote1.
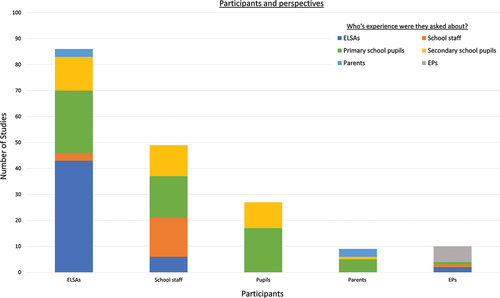
Table 1. Participants and perspectives. Numbers in brackets indicate the number of studies included within each cell and numbers in the final row indicate the total number of studies within each column.
Table 2. Participants and topics.
Table 3. Purpose and design
Figure 3. Data from Table 1: Participants and perspectives presented as a stacked bar graph.