
Figures & data
Figure 1. NEET definition flowchart
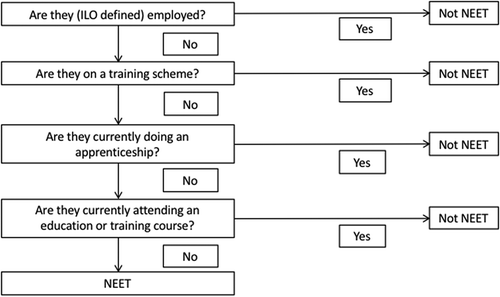
Figure 2. The NEET rate, 1975–2015
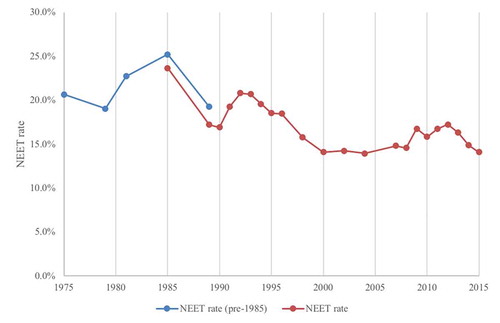
Figure 3. Active and inactive NEET rates by gender, 1975–2015 (a) Male (b) Female
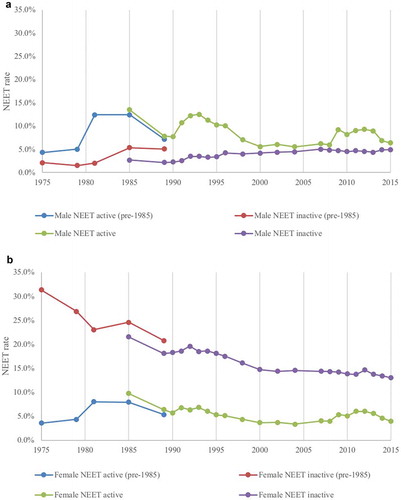
Table 1. Factors associated with being NEET among men, 1985–2015
Table 2. Factors associated with being NEET among women, 1985–2015
Table 3. Comparison of aggregate composition and coefficient effects using linear and non-linear models
Figure 4. Compositional effects on NEET rates by gender, 1985–2015 (a) Male (b) Female
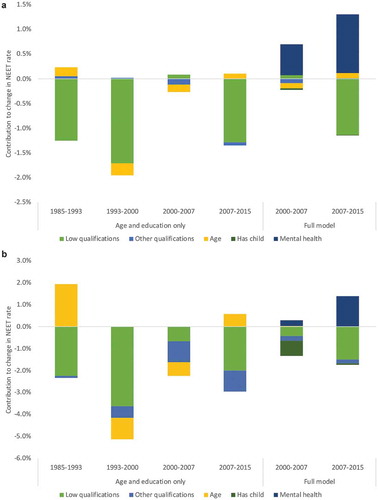
Figure 5. Coefficient effects on NEET rates by gender, 1985–2015 (a) Male (b) Female
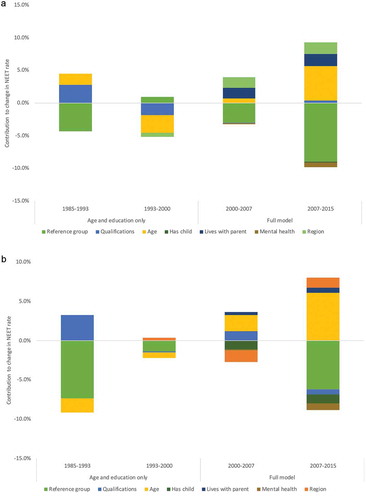
Table A2: Comparison on linear probability model and logit model for NEET risk factors
Table A3: Composition effects from Blinder-Oaxaca decomposition of probability of being NEET, 1985–2015
Table A4: Comparison of composition effects estimated by linear probability model and logit model/Fairlie (Citation2005)
Table A5: Coefficient effects from Blinder-Oaxaca decomposition of probability of being NEET, 1985–2015