
Figures & data
Table 1. Status alphabet.
Figure 1. Four cluster solution with silhouette sorting using the LCS algorithm.
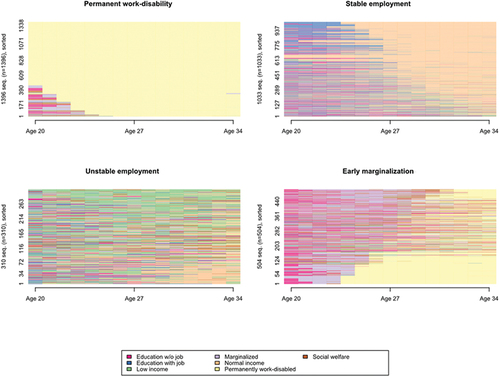
Table 2. Descriptive statistics of clusters for disabled and non-disabled.
Figure 2. Linear probability models on disabled population, coefficients with 95% confidence intervals.
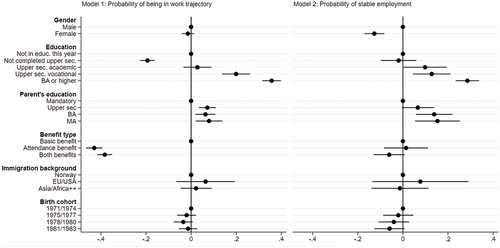
Figure 3. Linear probability models on nondisabled population, coefficients with 95% confidence intervals.
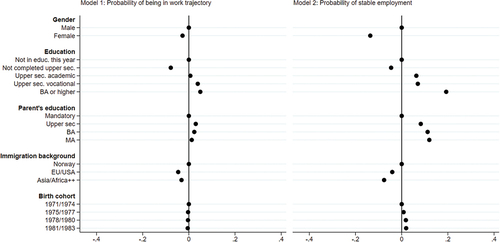
Figure 4. Predicted probabilities for disabled population of stable employment for men and women by education.
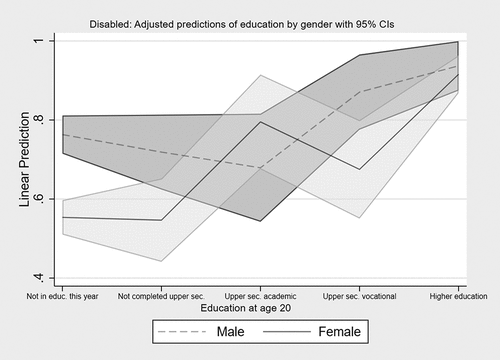
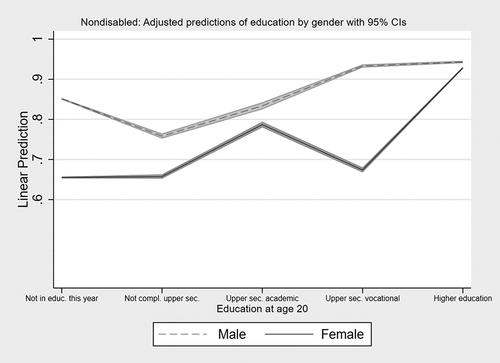
Figure 5. Predicted probabilities for nondisabled population of stable employment for men and women by education.
Supplemental material