
Figures & data
Figure 1. Screenshot of the question on subjective social stratification with a rating scale in the form of a ladder. Note. We used an optimized survey layout preventing horizontal scrolling and facilitating survey navigation. The screenshot shows the presentation on a PC.
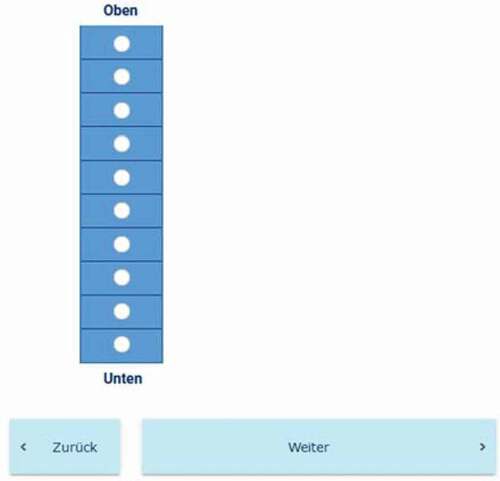
Figure 2. Screenshot of the question on subjective social stratification with a rating scale in the form of a pyramid. Note. We used an optimized survey layout preventing horizontal scrolling and facilitating survey navigation. The screenshot shows the presentation on a PC.
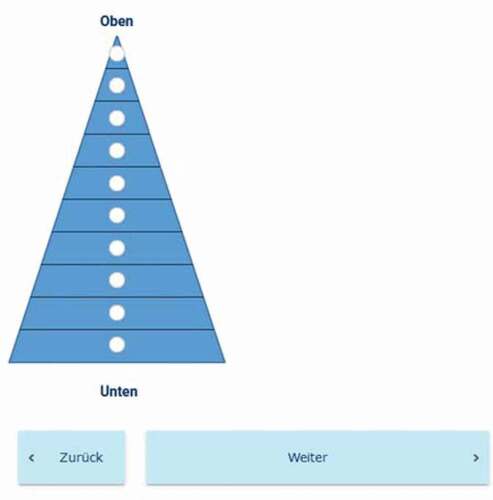
Table 1. Response distributions (in percentage) and median response times (in seconds) of the target question on subjective social stratification by experimental condition (ladder or pyramid)
Table 2. OLS regressions predicting personal income, school-leaving qualification, and professional qualification with subjective social stratification (unstandardized coefficients)