
Figures & data
Figure 1. Network diagram: The network of excerpts (shaded circles), with the thickness of the edge indicating the number of so-researchers who sorted the pair of excerpts into the same pile. The colour indicates groups identified in Step 3: Group 1 (light blue); Group 2 (green); Group 3 (pink); Group 4 (red); Group 5 (yellow) and Group 6 (orange).
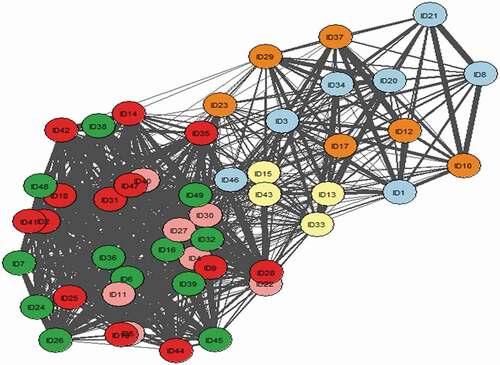
Table 1. List of group 1 excerpts
Recruitment of Co-researchers
Full list of excerpts and groups produced during Step Four
Spreadsheet Input during Step Four
Number of Excerpts within each group
Summary of themes developed across groups