
Figures & data
Table 1. Definition of technical success for the intention of this study, based on Chaikof et al.’s [Citation22] reporting standards for EVAR.
Table 2. Patient data and operator’s level of experience for all patients.
Figure 1. Boxplots presenting operative metrics for both groups (median (range)). (a) endovascular procedure time (minutes) measured from first angiogram till the last one, p = .017, (b) contralateral gate cannulation time (minutes), p = .785. The time was measured from the moment the operator started manipulating the contralateral catheter in the distal part of the aorta with the intention to cannulate the contralateral limb, and was ended when the operator rotated the catheter at the proximal end of the stent graft thereby verifying that the catheter was within the proximal end of the stent graft, (c) total fluoroscopy time (minutes), p = .255, (d) number of angiograms, p = .392, (e) total radiation dose/dose area product ( p = .605, (f) contrast medium use (ml), p = .328. The middle band shows the median value, the bottom and the top of the boxes show the 25th and the 75th percentiles, and the ends of the whiskers show the 5th and the 95th percentiles. Outliers are plotted as circles and extreme outliers as stars.
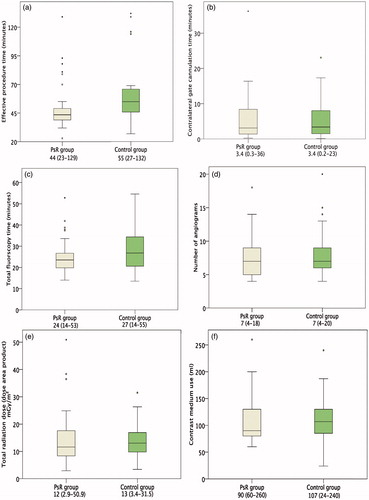
Figure 2. Final angiograms of the PsR and the real procedure (RP) for two patients: one that ended with primary technical success (patient I) and the one that ended with assisted primary technical success (patient II).
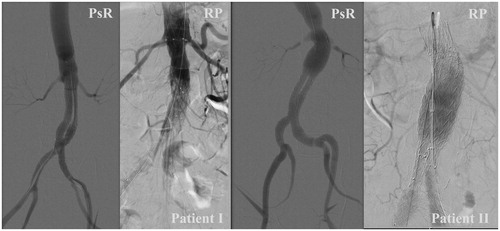
Table 3. Primary and assisted primary technical success, and technical failure rates.