Figures & data
Figure 1. Flow chart of selection process in this meta-analysis.
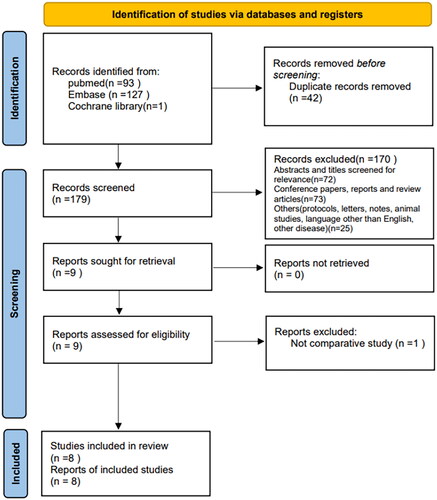
Table 1. The Newcastle-Ottawa scale (NOS) score of the literature.
Table 2. The baseline characteristics quality assessment of the included studies.
Figure 2. Forest plots of the effect of LLR vs. OLR on (A) operation time, (B) intraoperative blood loss, (C) intraoperative transfusion rate, (D) resection margin size, (E) R0 resection rate. Mean difference (MD) and odds ratios (OR) shown with 95% confidence intervals.
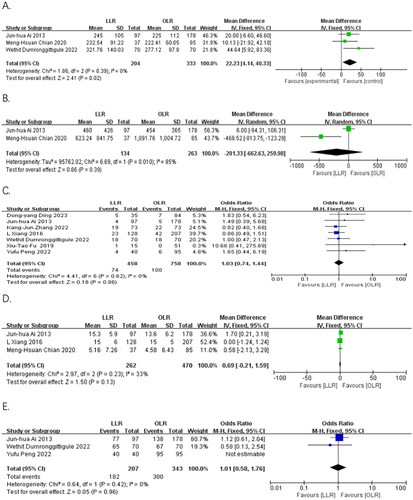
Figure 3. Forest plots of the effect of LLR vs. OLR on (A) total postoperative complication rate and (B) major complication rate (≥ grade III). Odds ratios (OR) shown with 95% confidence intervals.
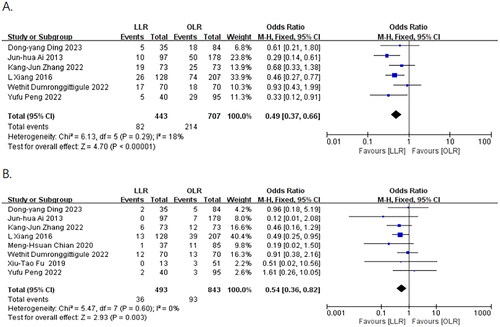
Figure 4. Forest plots of the effect of LLR vs. OLR on postoperative hospital stay time. (A) include five studies, (B) after excluding one study, mean difference shown (MD) with 95% confidence intervals.
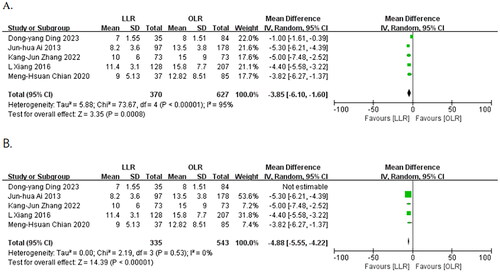
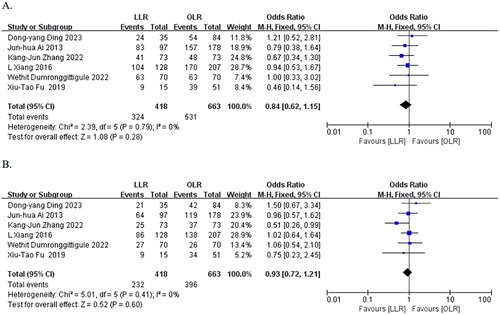
Figure 5. Forest plots of the effect of LLR vs. OLR on A) 3-year OS rate, B) 3-year DFS rate. Odds ratios (OR) shown with 95% confidence intervals.