Figures & data
Figure 1. Schematic of an RDE.
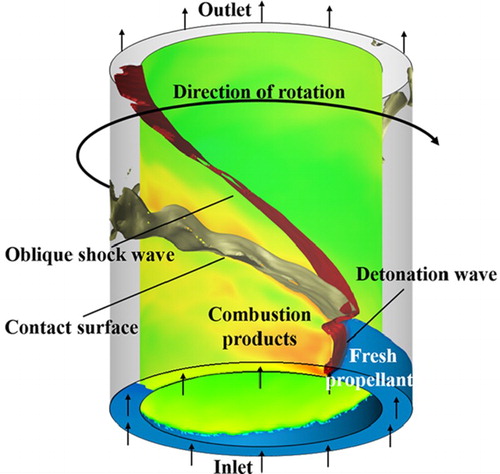
Figure 2. Typical RDE flow field in a two-dimensional simulation a-fresh propellants; b-reaction products; c-reaction products from the previous cycle.
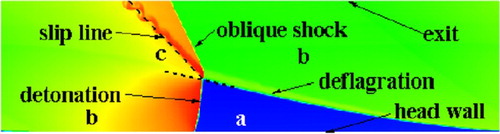
Figure 3. Ideal detonation-inert model in the wave-fixed reference frame
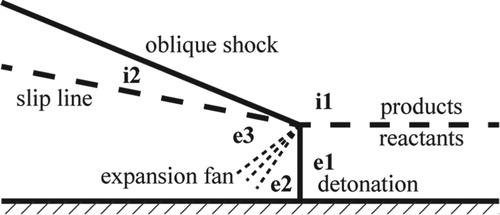
Figure 4. ZND model in the steady quasi-1D analysis.
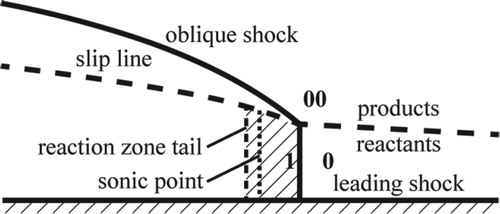
Figure 5. Profiles of the flow field calculated by the one-step kinetic model (a) pressure; (b) temperature; (c) expansion slope; (d) Mach number.
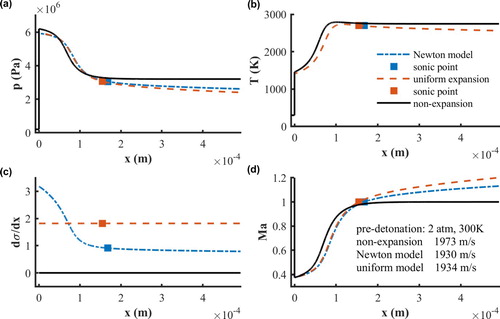
Figure 6. Comparison of p-v diagram between expansion and non-expansion detonation waves.
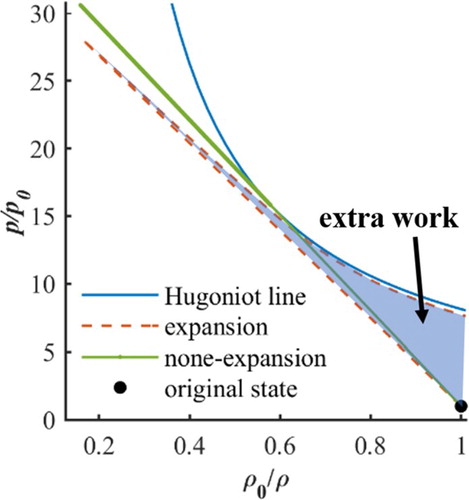
Figure 7. Normalised velocity of detonation (colour and line labels) under the variation of the pre-detonation state, where
denotes
(a) with a constant temperature of 450 K; (b) with constant pressure 2 atm.
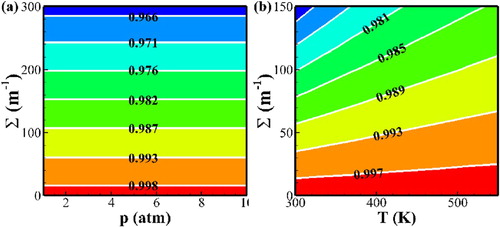
Figure 8. Comparison of the reaction rate when the pre-detonation temperature changes at 2 atm (a) reaction rate (b) extra work in reaction process in front of sonic point (In the p-v diagram, the extra work can be defined as the area between the leading shock process line and reaction-expansion process line shown in Fig. ).
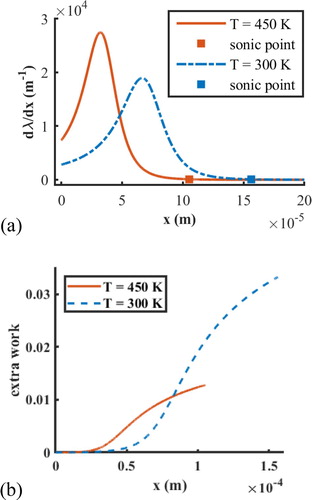
Figure 9. Profiles of the flow field calculated by two-step kinetics model with pre-detonation (a) pressure; (b) temperature; (c) expansion slope; (d) Mach number.
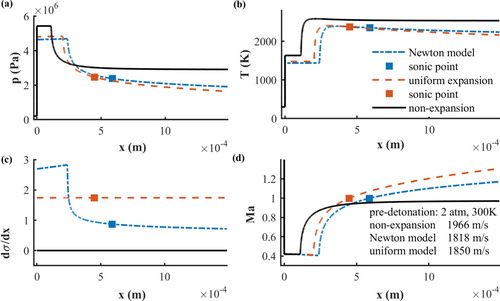
Figure 10. Normalised velocity of detonation and equilibrium reaction progress parameter (colour and line labels) under the pre-detonation state variation, where denotes
(a) the normalised deficit of velocities
with a constant temperature of 450 K; (b) normalised deficit of velocities
with constant pressure of 2 atm; (c) equilibrium reaction progress parameter
with a constant temperature of 450 K; (d) equilibrium reaction progress parameter
with a constant pressure of 2 atm.
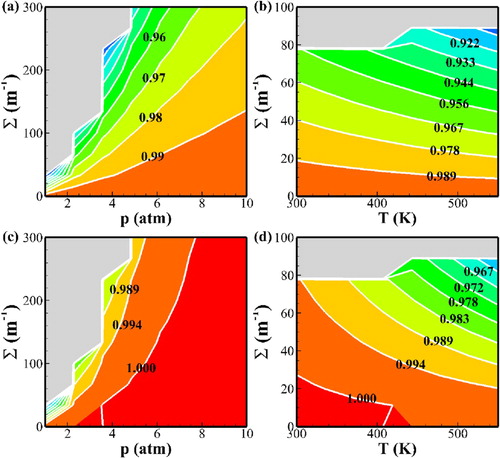
Figure 11. Definition of geometric parameters in the RDE flow field.
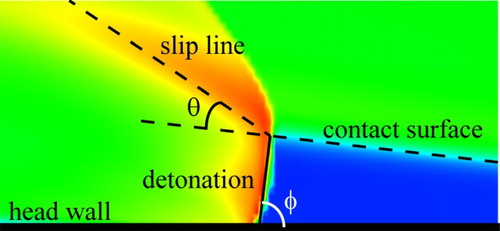
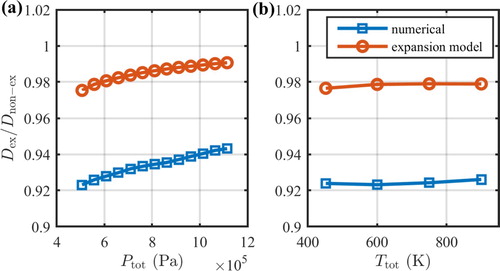
Figure 12. Comparison between the numerical and expansion model for the deficit of the detonation velocity when the inlet stagnation state changes (a) with a constant total temperature of 450 K; (b) with a constant total pressure of 5 atm.