Figures & data
Figure 1. Map of Tanzania with districts where the research was conducted.
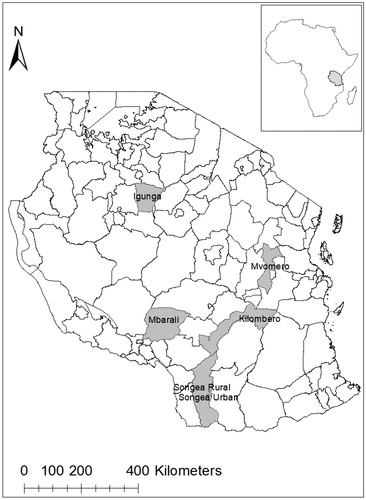
Table 1. Some background information on fish pond farming in the surveyed districts (URT, Citation2016b).
Table 2. Gender, age, pond size, household size, education level, and experience among interviewed fish farmers in selected districts in Tanzania.
Table 3. Annual average household income (US$/year) from fish farming and other sources and their contribution to the household income.
Table 4. Summary of regression model of the total household income as determined by fish and non-fish incomes.
Table 5. Average income (US$ per year) of household grouped by income sources and degree of livelihood diversification.
Figure 2. Farmers’ estimates on different utilization proportion of the cultured fish. Source: Field survey, April–July 2017.
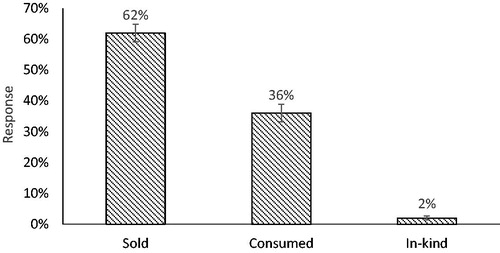
Figure 3. Gender and age groups participating in household fish farming management practices. Source: Field survey, April–July 2017.
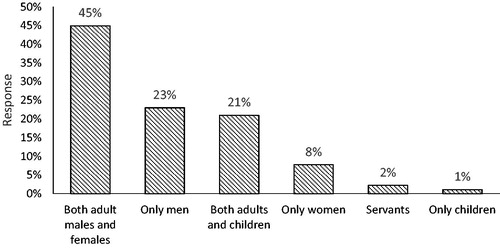
Table 6. Spearman correlation results for factors associated with income from fish farming.
Figure 4. Farmers’ future plan regarding fish farming. Source: Field survey, April–July 2017.
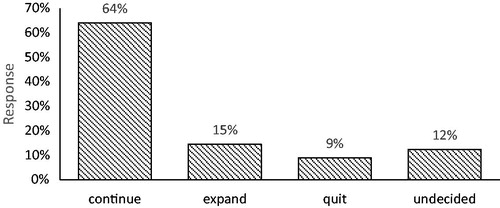
Table 7. Farmers’ perception on fish farming challenges and their severity.
Figure 5. Farmers’ perception on the adoption rate of fish farming in the community. Source: Field survey, April–July 2017.
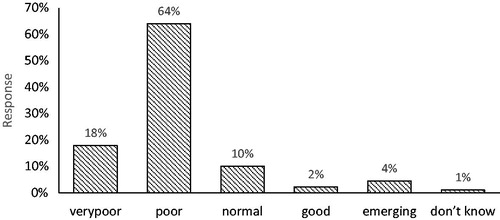
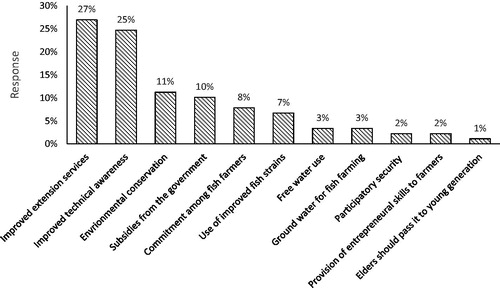
Figure 6. Reasons for poor community fish farming adoption status based on farmers’ perception. Source: Field survey, April–July 2017.
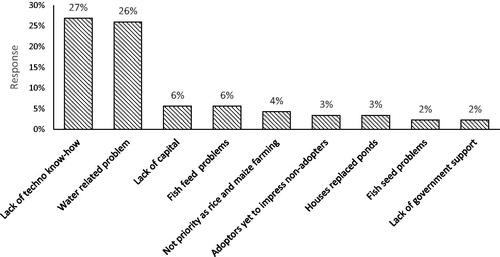
Figure 7. Farmers’ perception on measures to be taken to improve fish farming adoption rates in Tanzania. Source: Field survey, April–July 2017.