Figures & data
Table 1. Definitions.
Table 2. List frame development, Pacific coast shellfish survey, 2017.
Table 3. Coverage and response rates, Pacific coast shellfish survey, 2017.
Figure 1. Percentage of Pacific coast shellfish farm 2017 survey respondents by farm size.
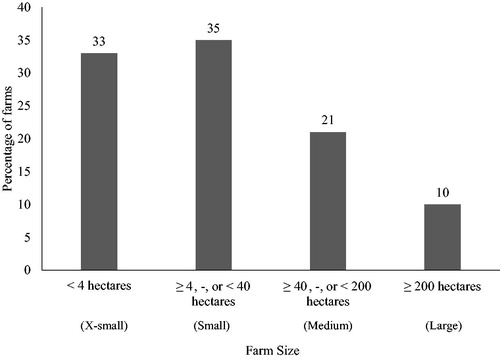
Figure 2. Primary challenges to Pacific coast shellfish farms among 2017 survey respondents.
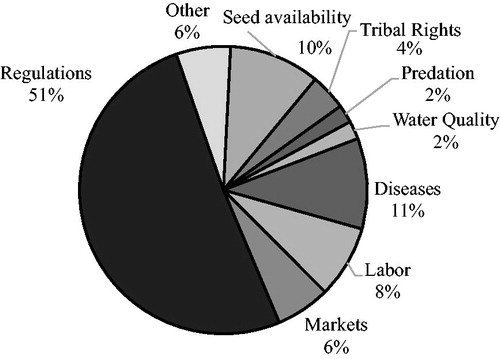
Figure 3. Ranking of regulations reported by Pacific coast shellfish 2017 survey respondents as causing the greatest problems for their shellfish business, Pacific coast shellfish survey respondents, 2017.
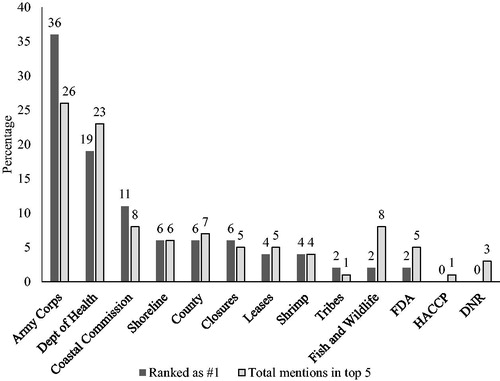
Table 4. Lost markets, lack of business expansion, unexpected changes, farms that have gone out of business due to regulations, Pacific coast shellfish survey respondents, 2017 (N = 48).
Table 5. Total number of recurring regulatory filings (includes all applications required), Pacific coast shellfish survey respondents, 2017.
Table 6. Total number of recurring regulatory filings reported (includes all applications required) by level of government agency, Pacific coast shellfish survey respondents, 2017.
Table 7. Number of recurring permits/filings by regulatory category, Pacific coast shellfish survey respondents, 2017.
Table 8. Number of recurring permits/filings by regulatory category by state, Pacific coast shellfish survey respondents, 2017.
Table 9. Total annual regulatory cost by state.
Table 10. Annual effects on farm sales revenue by state.
Table 11. Annual regulatory costs by type of cost.
Table 12. Annual regulatory cost by type of regulation, excluding Manpower,Table Footnotea Pacific coast shellfish survey respondents, 2017.
Figure 4. Average manpower expended for obtaining licenses and permits, Pacific coast shellfish survey respondents, 2017.
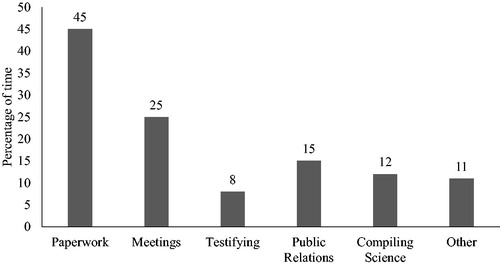
Table 13. Annual regulatory costs associated with obtaining permits by farm and by state.
Figure 5. Average manpower expended for regulatory monitoring and compliance, Pacific coast shellfish survey respondents, 2017.
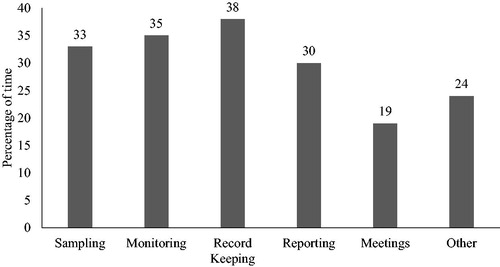
Table 14. Annual regulatory costs of monitoring and compliance by farm and by state.
Table 15. Pacific coast regulatory costs as percent of total costs (production and marketing costs), and sales.
Table 16. Total annual regulatory cost by farm size.
Table 17. Effects on annual farm sales revenue (lost sales and lost opportunities) by farm size.
Table 18. Farm size effects by types of annual regulatory costs.
Table 19. Farm size effects of regulatory costs: mean and median percent of total costs (production and marketing costs) and sales.
Table 20. Means of annual costs associated with obtaining permits by farm size.
Table 21. Means of annual costs of monitoring and compliance by farm size.
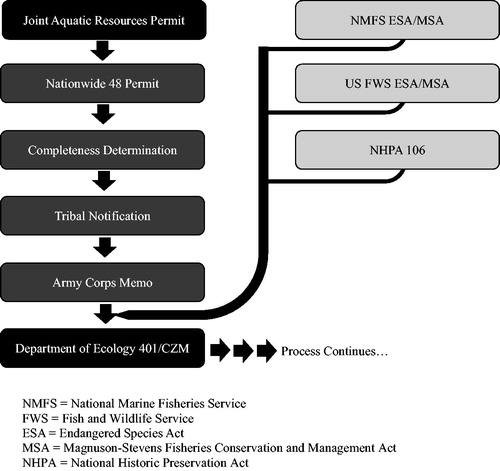
Figure 6. Truncated example of sequential shellfish permits for Washington state producers, Pacific coast shellfish survey respondents, 2017.