Figures & data
Figure 1. Topics for collaboration in the Norwegian aquaculture industry.
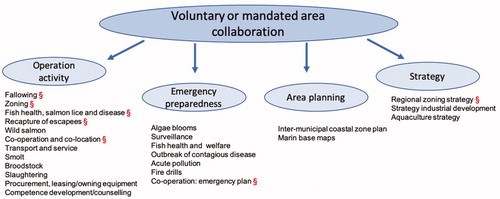
Figure 2. The informants’ responses to why they choose to cooperate with others measured on questions “we cooperate to reduce the risk for diseases and parasites,” “we cooperate to reduce negative environmental impacts,” and “we cooperate to improve profitability.” Numbers shown as frequencies, N = 37.
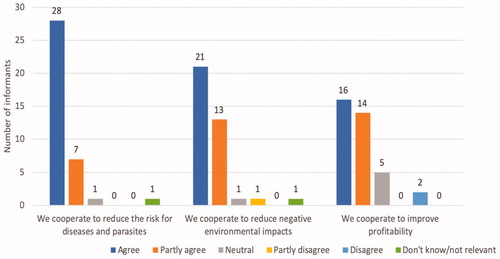
Figure 3. The informants’ responses as to what they consider important to coordinate in order to optimize sea production, measured on statements “it is important to coordinate fallowing,” “it is important to coordinate sea transfer,” and “it is important to coordinate delousing.” Numbers shown as frequencies, N = 37.
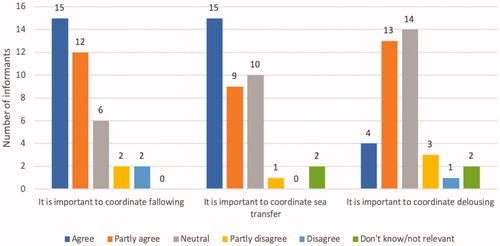
Figure 4. Informants’ responses to the statement “public authorities should be responsible for establishing cooperation.” Numbers shown as frequencies, N = 37.
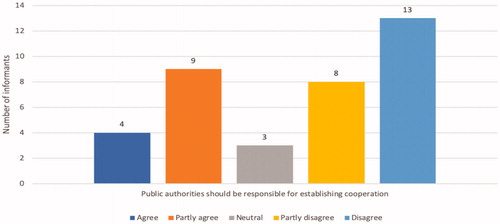
Figure 5. Informants’ responses to the statement “cooperation should be voluntary.” Numbers shown as frequencies, N = 37.
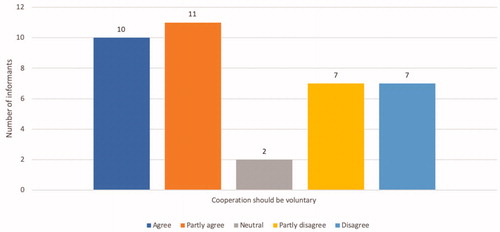
Figure 6. Informants’ responses to the question “How well do you cooperate with other fish farms in your area?.” Numbers shown as frequencies, N = 37.
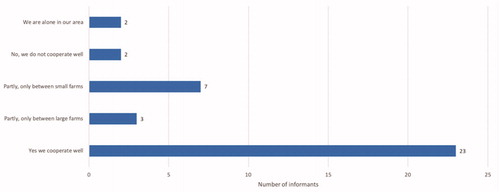
Figure 7. Informants’ responses as to why they think conflicts arise between fish farmers, measured on statements “conflicts arise when there are several farms in one area,” “conflicts arise when there is short distance between farms,” and “conflicts arise for other reasons.” Numbers shown as frequencies, N = 37.
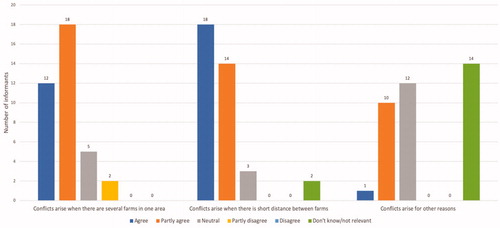
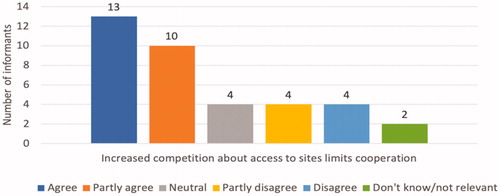
Figure 8. Informants’ responses to the statement “increased competition about access to sites limits cooperation.” Numbers shown as frequencies, N = 37.
Model 1. A simple performance model for self-governance arrangements in area collaboration.