
Figures & data
Figure 1. Model framework to simulate the economic performance of sea bass production.
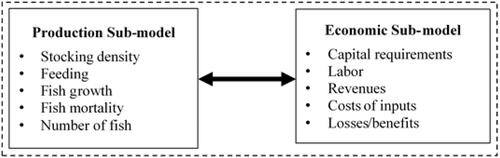
Table 1. Annual operating costs of a grow-out farm.a
Table 2. Parameter values depending on the farm size.
Table 3. Parameter values depending on the production strategy.
Figure 2. Economic performance of a typical grow-out farm under different scenarios of production (baseline values).
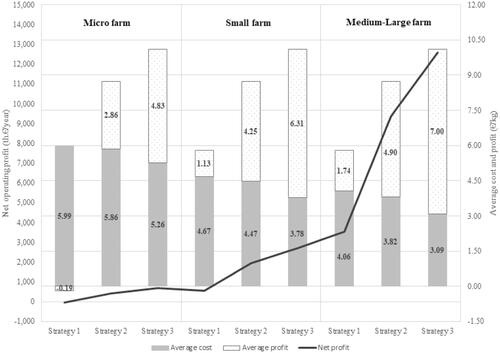
Table 4. Operating risk of a typical grow-out farm under different scenarios of production (baseline values).
Table 5. Variation in the net operating profit caused by a change of ±10% in some key operational parameters.
Table 6. Parameters values to achieve a null net operating profit (break-even values).
Table 7. Parameters values to compensate a 10% of decrease in the unit sales price (p).