
Figures & data
Figure 1. CVOW Lease area.
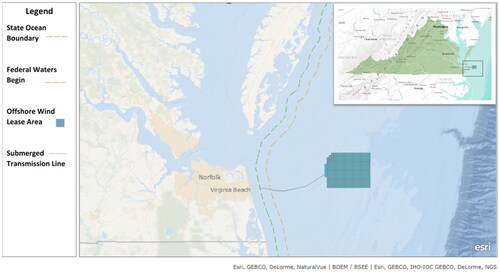
Table 1. Clarity and v alidity check questions.
Figure 2. Example choice set.
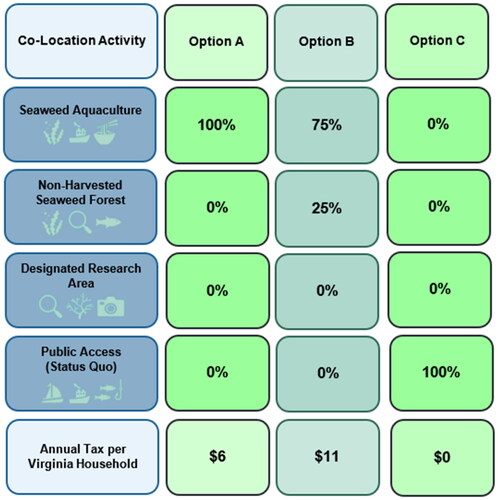
Table 2. Choice experiment attributes.
Table 3. General demographics.
Figure 3. Zip code survey response distribution map.
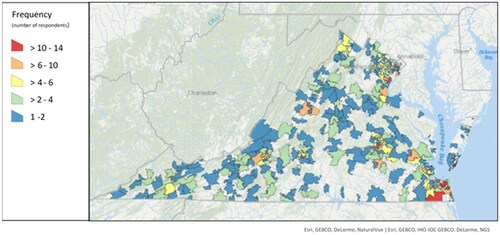
Table 4. Conditional logit estimation results.
Table 5. WTP Estimation results (annual $'s per HH).
Table 6. Estimated cost vs WTP comparison.