Figures & data
Figure 1. Location of the case study area in Iran (left) and within northern Iran (right).
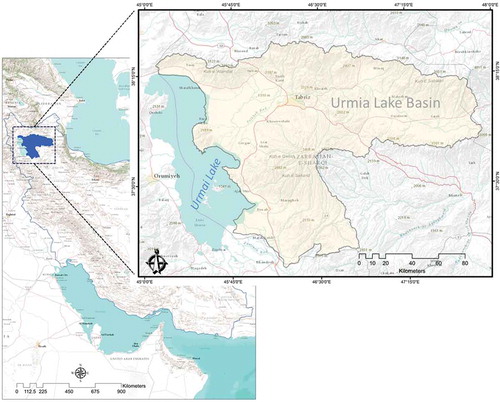
Table 1. Classification of GIS-MCDA based on their combination rules and applied methods for LSM.
Figure 2. Methodology flowchart of the research.
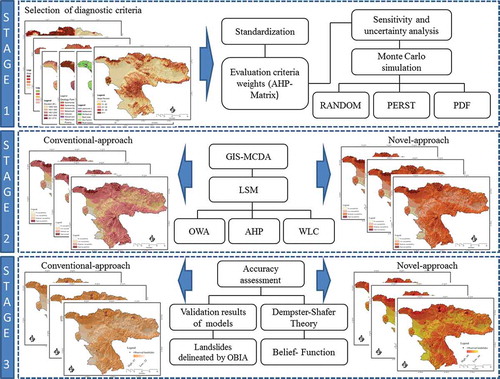
Table 2. The mean consistency index of randomly generated matrices (Saaty Citation1977).
Figure 3. AHP decision tree for LSM.
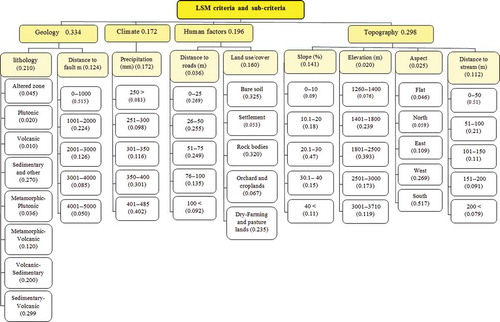
Table 3. Pairwise comparison matrix for data set layers of landslide analysis.
Table 4. Minimum and maximum withed for PDF.
Figure 4. Scheme of MCSs to GIS-MCDA-based LSM.
Figure 5. Schematic relationships of evidential belief functions (Althuwaynee et al. 2012).
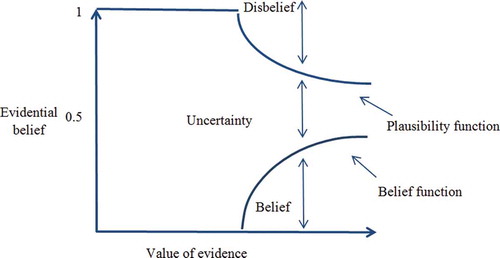
Figure 6. Landslide susceptibility maps (LSM) of ‘conventional’ and ‘novel’ approaches: (a) LSM derived from WLC, (b) LSM based on the AHP method, (c) LSM from the OWA method, (d) LSM derived from MCS-WLC, (e) LSM based on the MCS-AHP method, and (f) LSM from the MCS-OWA method.
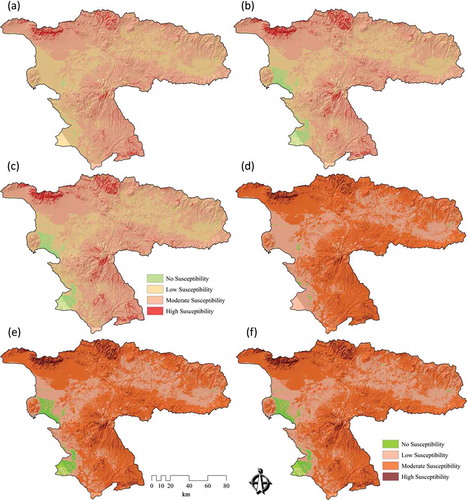
Figure 7. Uncertainty assessment (UA) for results of landslide susceptibility maps (LSM) of ‘conventional’ and ‘novel’ approaches: (a) UA results of the belief function for LSM derived from WLC, (b) UA results of the belief function for LSM based on the AHP method, (c) UA results of the belief function for LSM of the OWA method, (d) UA results of the belief function for LSM based on the MCS-WLC method, (e) UA results of the belief function for LSM of the MCS-AHP method, and (f) UA results of the belief function for LSM of the MCS-OWA method.
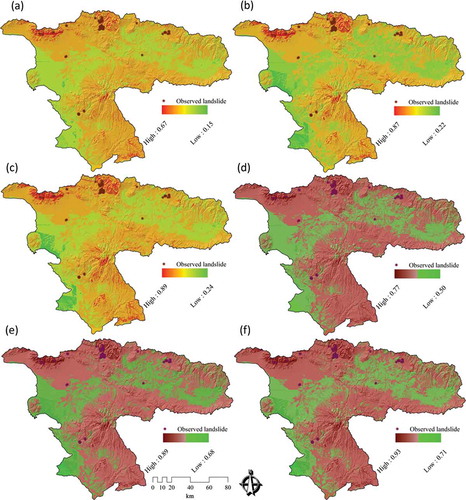
Table 5. Validation and certainty assessment (CA) of GIS-MCDA and GIS-MCS-MCDA results.
Table 6. Representation overall certainty and validation of results by DST and ROC curve.
Figure 8. Results of UA for a selected area for ‘conventional’ and ‘novel’ approaches of landslide susceptibility maps (LSM) of (a) UA results of the belief function for LSM derived based on WLC, (b) UA results of the belief function for LSM based on AHP, (c) UA results of the belief function for LSM based on OWA, (d) UA results of the belief function for LSM based on MCS-WLC, (e) UA results of the belief function for LSM based on MCS-AHP, and (f) UA results of the belief function for LSM based on MCS-OWA.
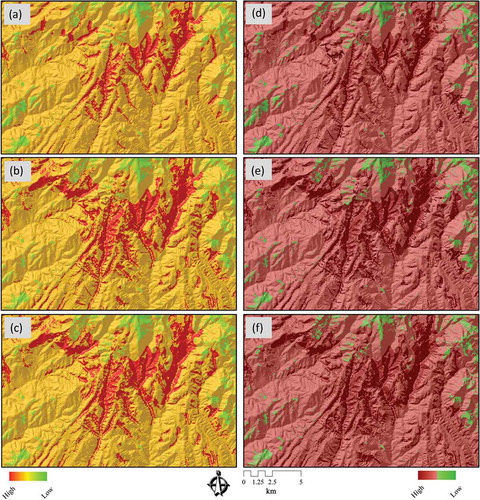
Figure 9. Landslide areas delineated by OBIA from IRS-ID satellite images (Feizizadeh and Blaschke Citation2013c).
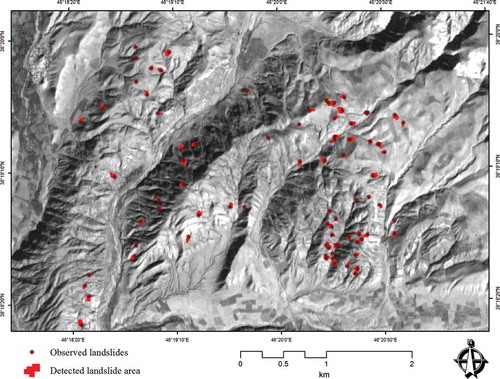
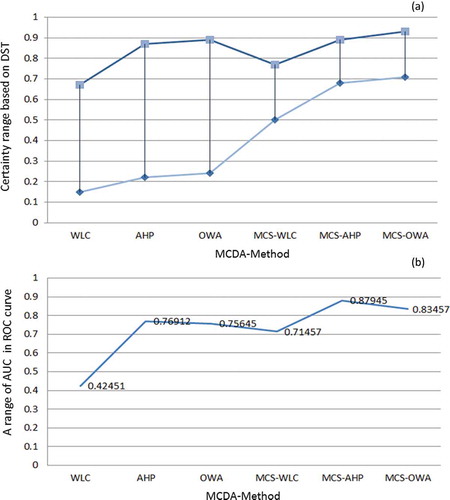
Figure 10. Comparative results of GIS-MCDA methods: (a) results of DST method for measuring the certainty and improved accuracy of GIS-MCDA by novel approach and (b) results of validation of methods based on ROC curve.