Figures & data
Figure 1. A moving object equipped with a GPS travels between two arbitrary positions.
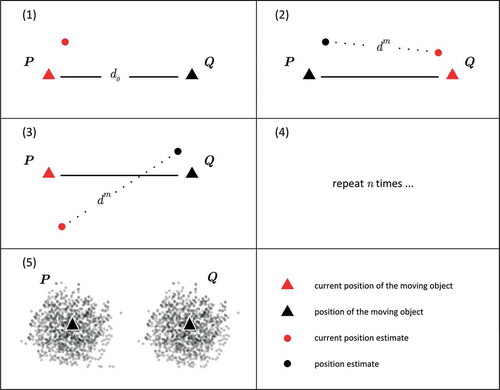
Figure 2. Overestimation of distance () and its influencing parameters.
Figure 3. The overestimation of distance ) increases as the spread of GPS measurement error (
) increases, the reference distance (
) is constant (a);
decreases as
increases and
is constant (b).
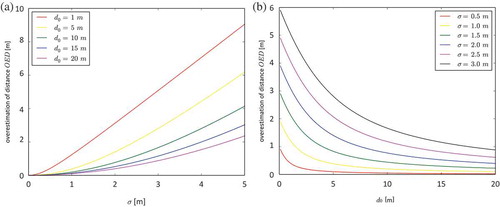
Figure 4. The distribution of GPS measurement error at position (a). Revealing the temporal autocorrelation of GPS measurement error (b). The movement of a pedestrian around a reference course (c).
Figure 5. Overestimation of distance () and spatial autocorrelation of GPS measurement error (
) in the pedestrian movement data.
Figure 6. Histogram of the difference between measured and reference distance () for
(a) and
(b).
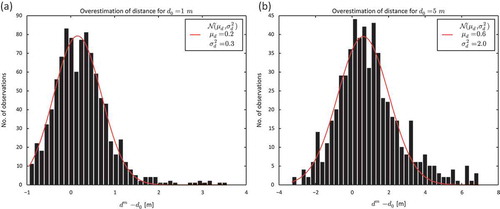
Figure 7. Overestimation of distance and temporal autocorrelation of GPS measurement error (
) in the pedestrian movement data.
Figure 8. Overestimation of distance () and spatial autocorrelation of GPS measurement error (
) in the car movement data.