3,610
Views
11
CrossRef citations to date
0
Altmetric
Original Articles

Spatial scale and small area population statistics for England and Wales

Pages 1187-1206 | Received 17 Mar 2015, Accepted 18 Oct 2015, Published online: 07 Dec 2015

Figures & data

Table 1. Key statistics census tables and derived variables.

Table 2. Counts and percentages.

Figure 1. (A) Percentage of Black, Asian and Minority Ethnic persons by OAs. (B) Percentage of persons with no qualifications by OAs. Contains National Statistics data © Crown copyright and database right 2012. Contains Ordnance Survey data © Crown copyright and database right 2012.
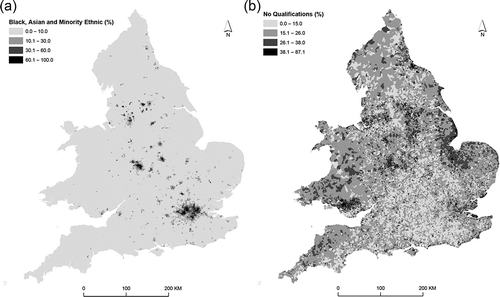
Figure 1. (A) Percentage of Black, Asian and Minority Ethnic persons by OAs. (B) Percentage of persons with no qualifications by OAs. Contains National Statistics data © Crown copyright and database right 2012. Contains Ordnance Survey data © Crown copyright and database right 2012.

Table 3. Index of dissimilarity, D (for stated sub-group versus remainder in category (e.g., A0to15 versus all others by age and White versus BAME)).

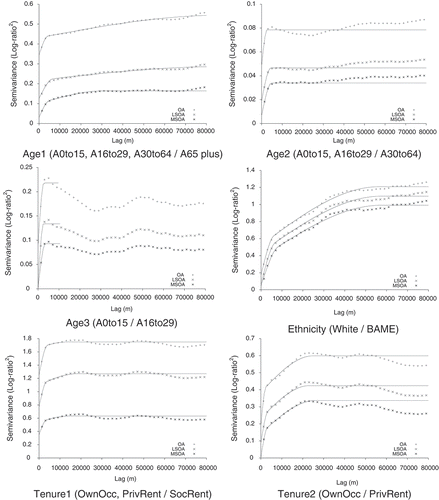
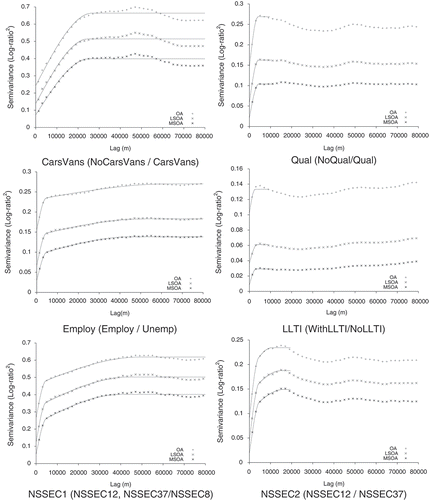
Figure 2. Variograms for all log-ratios for OAs, LSOAs and MSOAs (2 km lag).

Figure 2. Variograms for all log-ratios for OAs, LSOAs and MSOAs (2 km lag).

Figure 2. Continued.

Figure 2. Continued.

Table 4. Variogram model coefficients; ‘sph’ is spherical.