Figures & data
Figure 1. Workflow of the DND model.
Figure 2. Dependencies strength between neighbouring nodes. If someone needs to go from A to X, he must first go through B or C. From the perspective of graph theory, the cost from A to X is 2 degrees and the cost from B to X is 1 degree. It reflects that the dependencies strength between B and X is stronger than A and X.
Figure 3. Distant dependencies influence the destination distribution.
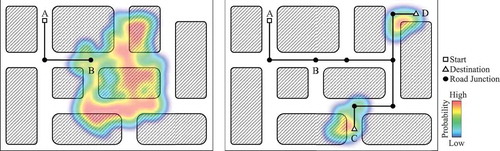
Figure 4. Framework of the DND model.
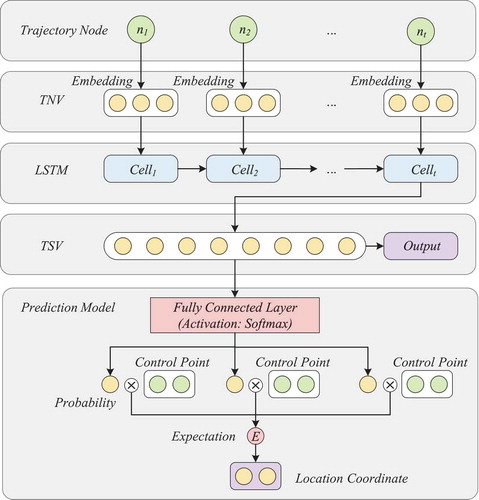
Figure 5. An example of destination prediction under six different completion scenarios of a full trajectory. Control points with a probability greater than 0.5% are labelled. As the completion increase, the predicted destination of the prefixes is gradually approaching the real destination. (a) Trajectory completion: 0%. (b) Trajectory completion: 8%. (c) Trajectory completion: 43%. (d) Trajectory completion: 68%. (e) Trajectory completion: 82%. (f) Trajectory completion: 98%.
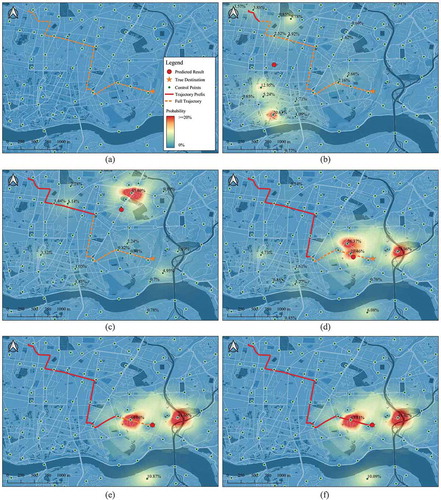
Table 1. Models for performance comparison.
Table 2. Performance comparison, both the units of and
are kilometres.
Figure 6. Error bar of final destination prediction according to trajectory completion.
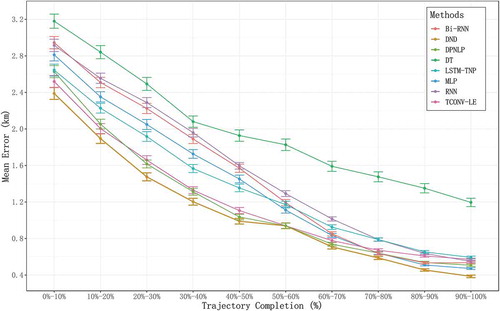
Figure 7. Error bar of final destination prediction according to trajectory length.
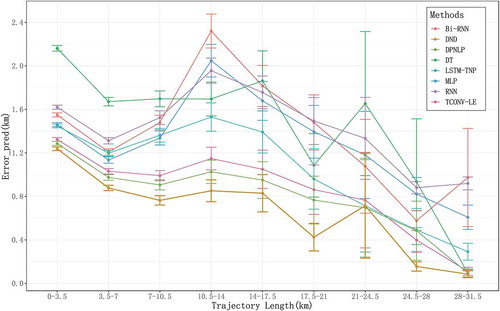
Figure 8. Scatter plot of mean Euclidean distance vs TNV similarity rank.
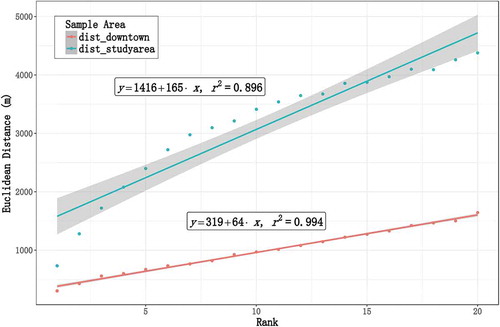
Figure 9. Scatter plot of mean degrees vs TNV similarity rank.
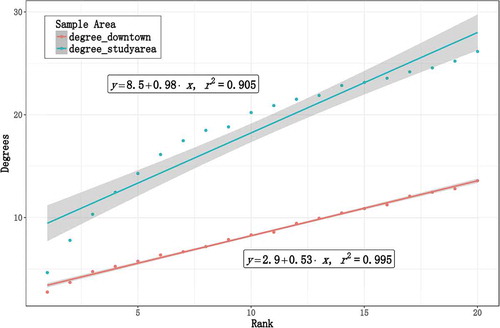
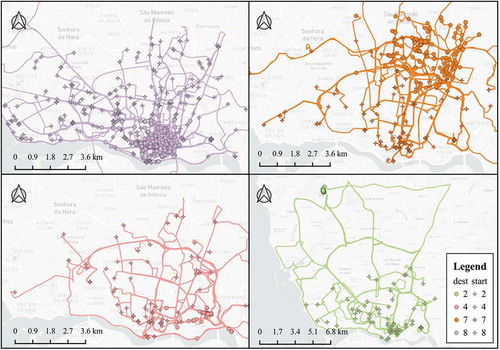
Figure 10. Geographic distribution of TSV clusters in Porto.
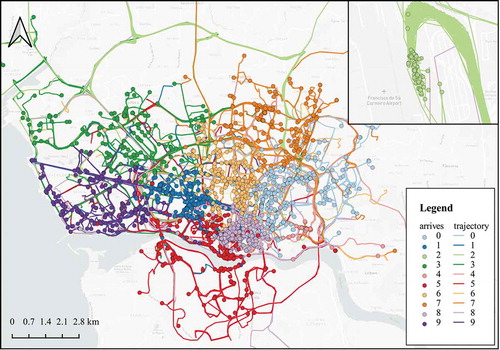
Figure 11. Start point distribution, destination distribution and road selection patterns of different TSV clustering results.