
Figures & data
Table 1. Sets of elements of the OSM dataset the numerical features of which are compared to Benford’s law
Table 2. Numerical features of an OSM element or of a tag value that are compared to Benford’s law
Figure 1. Comparison of the Hellinger distance and the Kullback-Leibler divergence. The plot contains data for all combinations of aspects considered and all countries
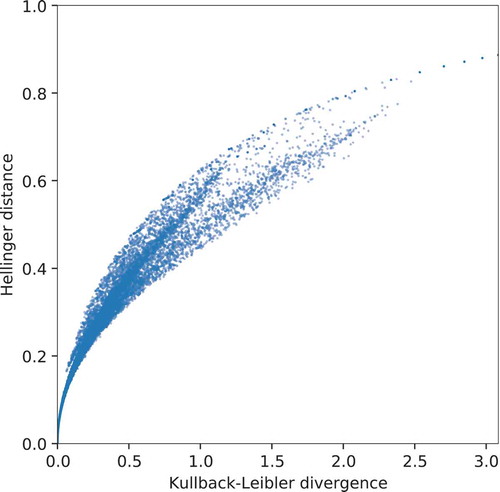
Figure 2. Comparison of several aspects of the OSM data to Benford’s law. High similarity (short Hellinger distance) between the actual distribution of an aspect in the OSM data and the Benford distribution is depicted in yellow, while low similarity (large Hellinger distance) is depicted in red and purple
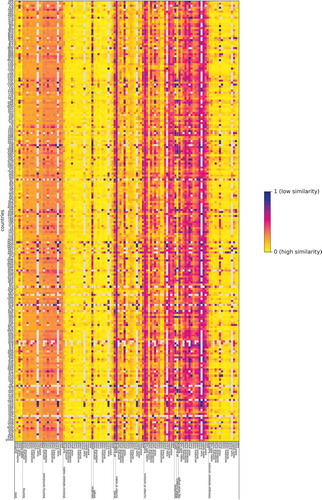
Figure 3. Similarity of spatial patterns for pairs of aspects. Each cell encodes the number of countries for which these two aspects do coincidentally not follow Benford’s law, i.e., for which the Hellinger distance between the actual distribution and the Benford distribution is larger than . Only aspects for which at least 80% of the countries follow the law have been included. The rows and columns have been reordered in order to achieve a block form
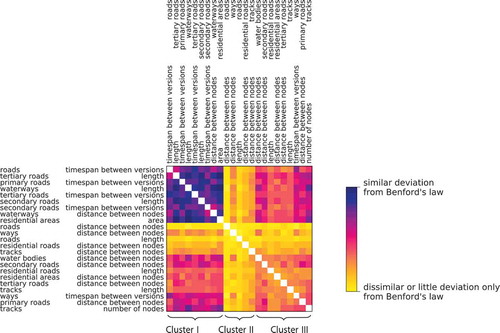
Figure 4. Spatial heterogeneity of the Hellinger distance for several aspects. For every aspect, the lowest and highest Hellinger distance observed are depicted in dark blue. The 25%–75%-quantile is depicted in bright orange, and the median is depicted in dark orange
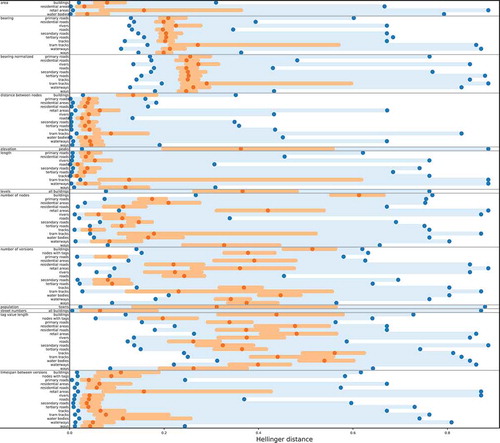
Figure 5. Areal maps depicting the degree to which Benford’s law applies to OSM data of different regions. The maps indicate the Hellinger distance between the OSM data and the Benford distribution by the colour scheme used. The country borders have been extracted from OSM data, thus including maritime boundaries in parts, and they have been generalized. The maps use the Behrmann projection
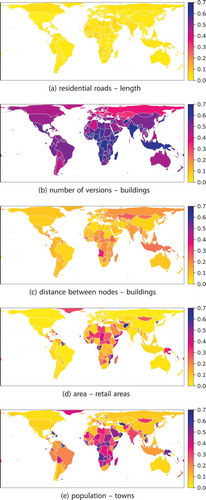
Figure 6. Similarity of thematic patterns for pairs of countries. Each cell encodes the number of aspects for which the corresponding two countries do coincidentally not follow Benford’s law, i.e., for which the Hellinger distance between the actual distribution and the Benford distribution is larger than . Only countries for which at least 80% of the aspects follow the law have been included. The rows and columns have been reordered in order to achieve a block form
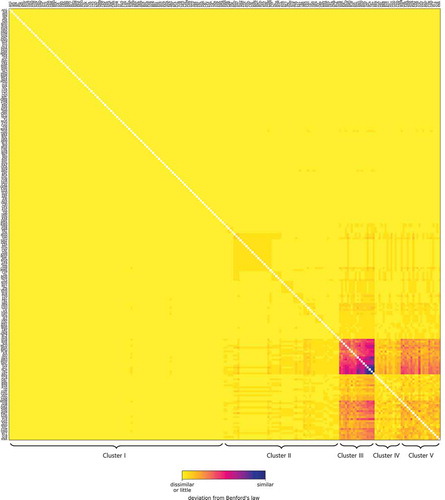
Figure 7. Spatial heterogeneity of the Hellinger distance, aggregated for all aspects. For every aspect, the lowest and highest Hellinger distance observed are depicted in dark blue. The 25%–75%-quantile is depicted in bright orange, and the median is depicted in dark orange
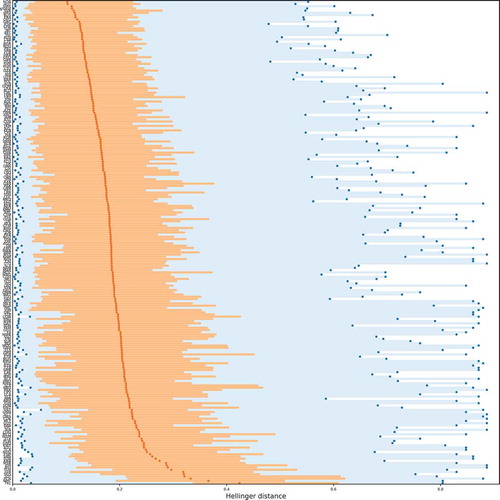
Figure 8. Correlation between the number of elements considered (sample size) and the Hellinger distance
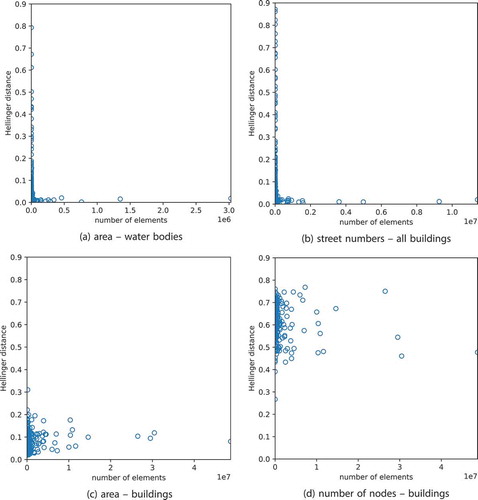
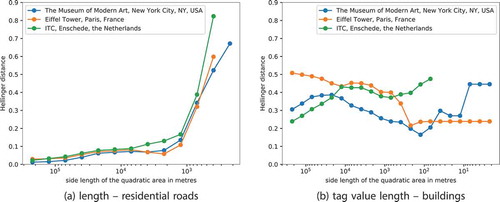
Figure 9. Influence of the study area on the Hellinger distance. No curve is drawn if no relevant data is contained in the study area. Note that the x-axes are scaled differently
Data and codes availability statement
The OpenStreetMap dataset can be downloaded at https://planet.openstreetmap.org. The data has been processed by the OSHDB software (Raifer et al., Citation2019). The corresponding code and further figures have been made available at https://doi.org/10.6084/m9.figshare.12991499.v1.