
Figures & data
Figure 1. An example ground Markov random field for east–west calculus.
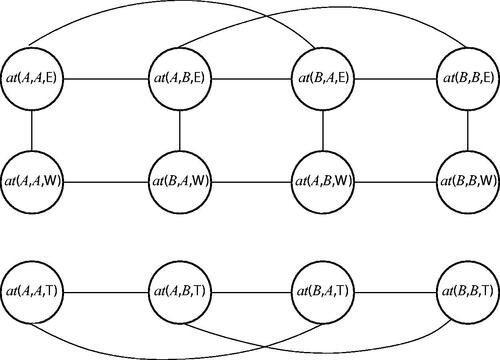
Figure 2. Example direction relations between relatum O1 and locata O2, F1 and F2.
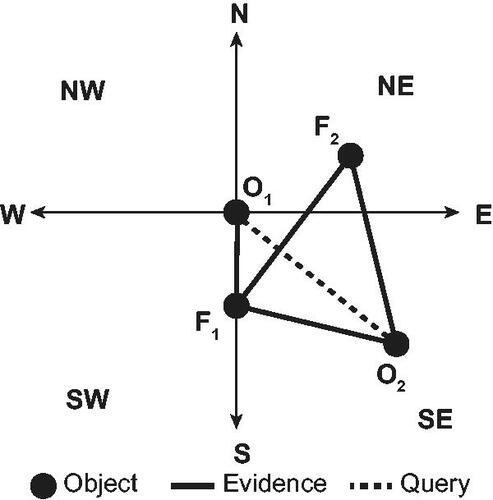
Figure 3. Results of experiment E1 with soft evidence SE1 with scenarios S1–3 with probabilities 1, 0.9 and 0.3, respectively.
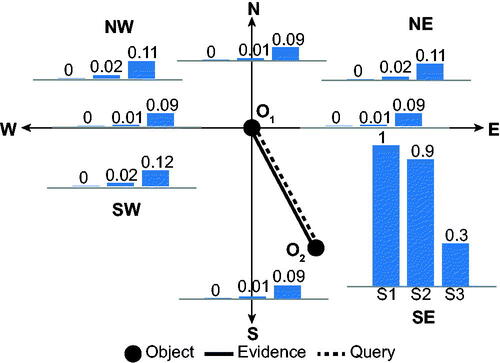
Figure 4. Results of experiment E2 with soft evidence SE2 and SE3
across scenarios S1–3 ().
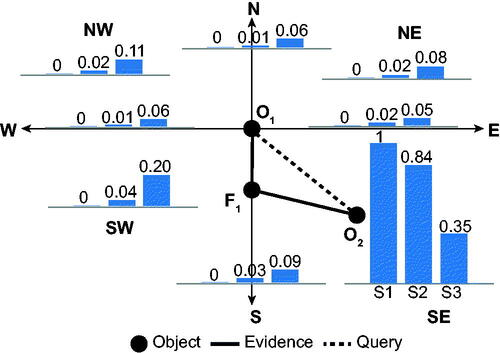
Figure 5. Results of experiment E3 with soft evidence SE2, SE4 and SE5 across scenarios S1–3 ().
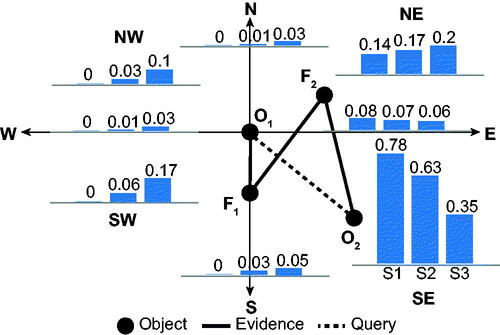
Figure 6. Examples of possible configuration of objects O1, O2, F1 and F2 consistent with evidence SE2, SE4 and SE5 in experiment E3 ().
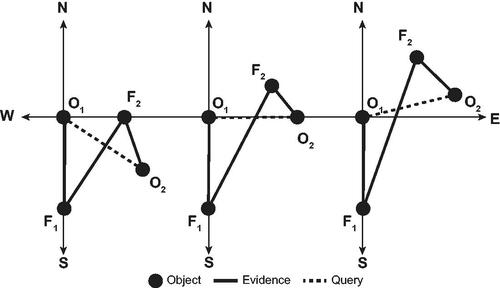
Figure 7. Results of experiment E4 with evidence SE2–5 across scenarios S1–3 ().
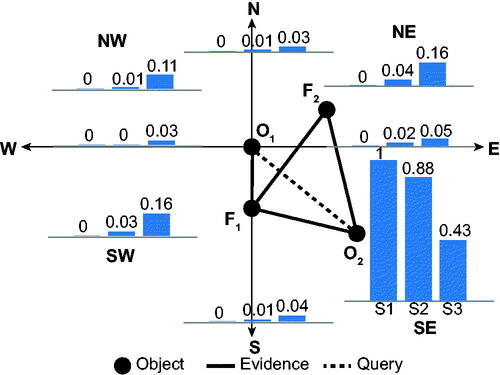
Figure 8. Examples of possible configuration of points O1, O2, F1 and F2 consistent with evidence SE3–6 in experiment E4 ().
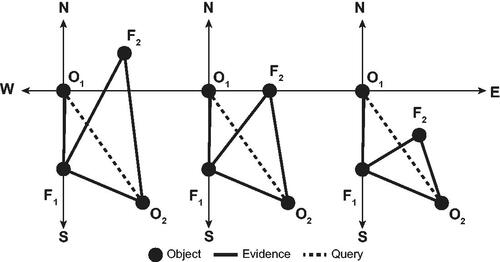
Figure 9. Results of experiment E5, extending experiment E2 with additional soft evidence for the direction relation between O1 and F1 ().
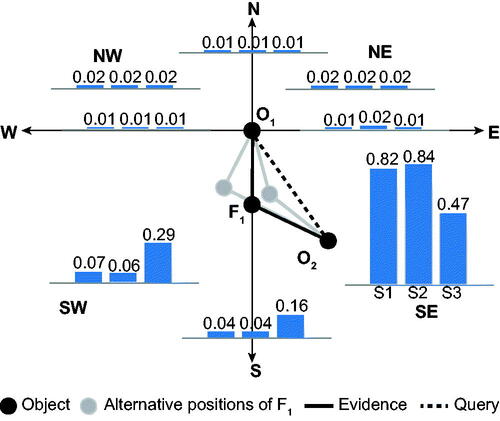
Figure 10. Three possible scenarios for inconsistent evidence where exactly one piece is neglected for each scenario (faded in graph).
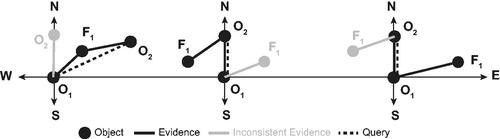
Figure 11. Results of experiment E6, extending experiment E2 with inconsistent evidence for the direction relation between O1 and O2, based on scenarios S1–3 in . The figure shows the spatial configuration from the left graph of only as an example (the configuration is strongly counter indicated by the resulting probabilities in scenario S3).
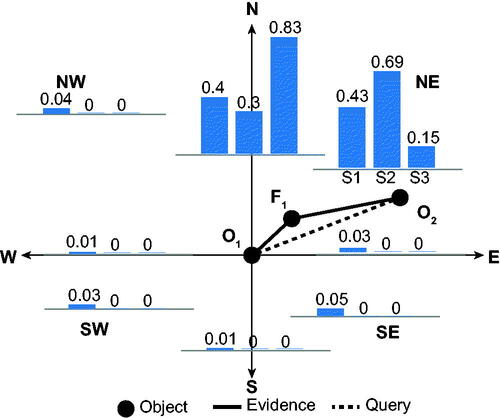
Table A1. MLN rule base for RCC-5.
Table A2. Exhaustive MLN rule base for CDC.
Table A3. MLN rule base for Allen’s interval algebra.
Table 1. Illustration of RCC relations.
Table 2. MLN rule-base for east–west calculus.
Table 3. Truth values for predicates in possible worlds Wa, Wb and Wc.
Table 4. Truth values for groundings of formula F1 in the world Wa, Wb and Wc.
Table 5. MLN rule base for point-based CDC relation.
Table 6. Experimental setup for experiments E1–4 with evidential statements SE1–5 and associated probability scenarios S1–3.
Table 7. Experimental setup for experiment E5, extending experiment E2 with additional soft evidence SE2a and SE2b and associated probability scenarios S1–3.
Table 8. Experimental setup for experiment E6 with soft evidence SE6–8 and associated probability scenarios S1–3.
Data and codes availability statement
The data and codes that support the findings of this study are available through Figshare at the link https://doi.org/10.6084/m9.figshare.21951047.v4.