
Figures & data
Figure 1. An overview of the proposed MCGCN model for traffic speed forecasting. It consists of three modules, including hierarchical spatial embedding, multivariate temporal modeling and attention-based multimodal fusion.
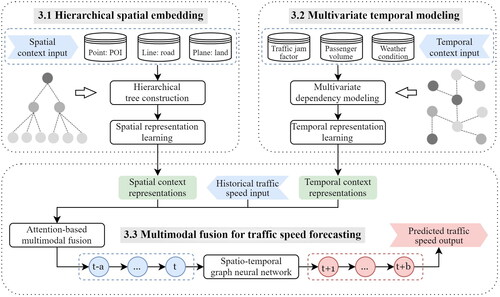
Figure 2. The architecture of the proposed MCGCN model for traffic speed forecasting. (a) Hierarchical spatial embedding. (b) Multivariate temporal modeling. (c) Attention-based multimodal fusion.
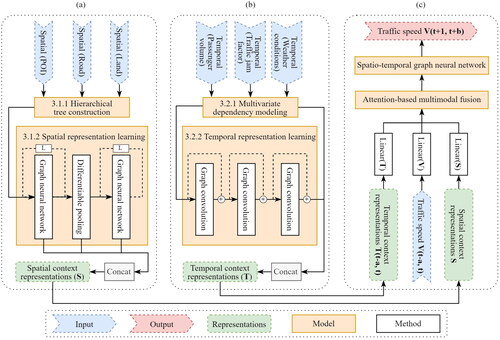
Figure 3. An overview of the traffic speed and multimodal context datasets in the study area. The subfigure provides an example of traffic speed values in Singapore’s downtown area. For simplicity, the legend for 28 kinds of land use is represented by three paralleled color-coded boxes.
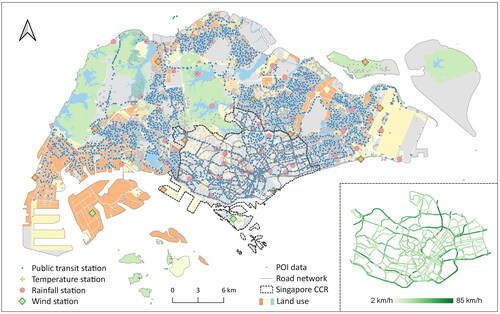
Table 1. The performance comparisons of multi-step traffic speed (km/h) prediction between the proposed MCGCN model and baseline models for various prediction horizons (30-min, 60-min and 120-min).
Figure 4. Prediction error maps of road segments between the predicted speed and the observed speed for various prediction horizons (30-min, 60-min and 120-min) with three representative models. (a1–a3) Seq2Seq. (b1–b3) STGCN. (c1–c3) The proposed MCGCN model. (d1–d3) Boxen plots of the above three models to illustrate their error distribution of 30-min, 60-min and 120-min speed prediction. The columns from left to right represent different horizons, ie 30-min, 60-min and 120-min. The color bar below shows the prediction error range for a1–c3.
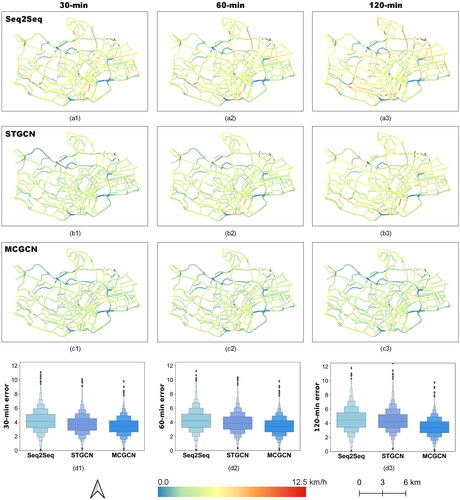
Figure 5. MAE values of learning the spatial context representations using the proposed hierarchical learning method and their differences from the non-hierarchical method every 10 min (ie non-hierarchical MAE – hierarchical MAE). (a) Workday. (b) Rest day.
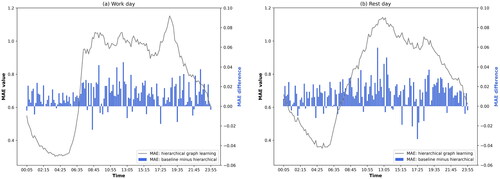
Table 2. The performance of multi-step traffic speed prediction for various prediction horizons (30-min, 60-min and 120-min; km/h) using the hierarchical and non-hierarchical methods to learn spatial context representations.
Table 3. The performance of multi-step traffic speed prediction for various prediction horizons (30-min, 60-min and 120-min; km/h) using the dependency and non-dependency methods to learn temporal context representations.
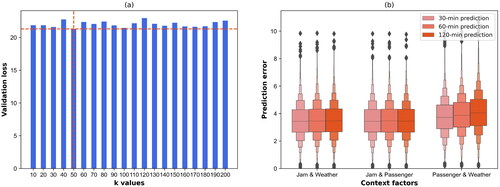
Figure 6. Performance analysis of multivariate temporal context modeling using different subgraph sizes and temporal context variables. (a) Validation loss of speed prediction when modeling multivariate temporal contexts with various subgraph sizes, ie k. (b) Prediction errors of speed prediction when using three different combinations of temporal contexts, ie (1) jam factors and weather conditions, (2) jam factors and passenger volumes and (3) passenger volumes and weather conditions.
Data and codes availability statement
The data and codes supporting the main findings of this study are available at https://doi.org/10.6084/m9.figshare.21813048.v1.